


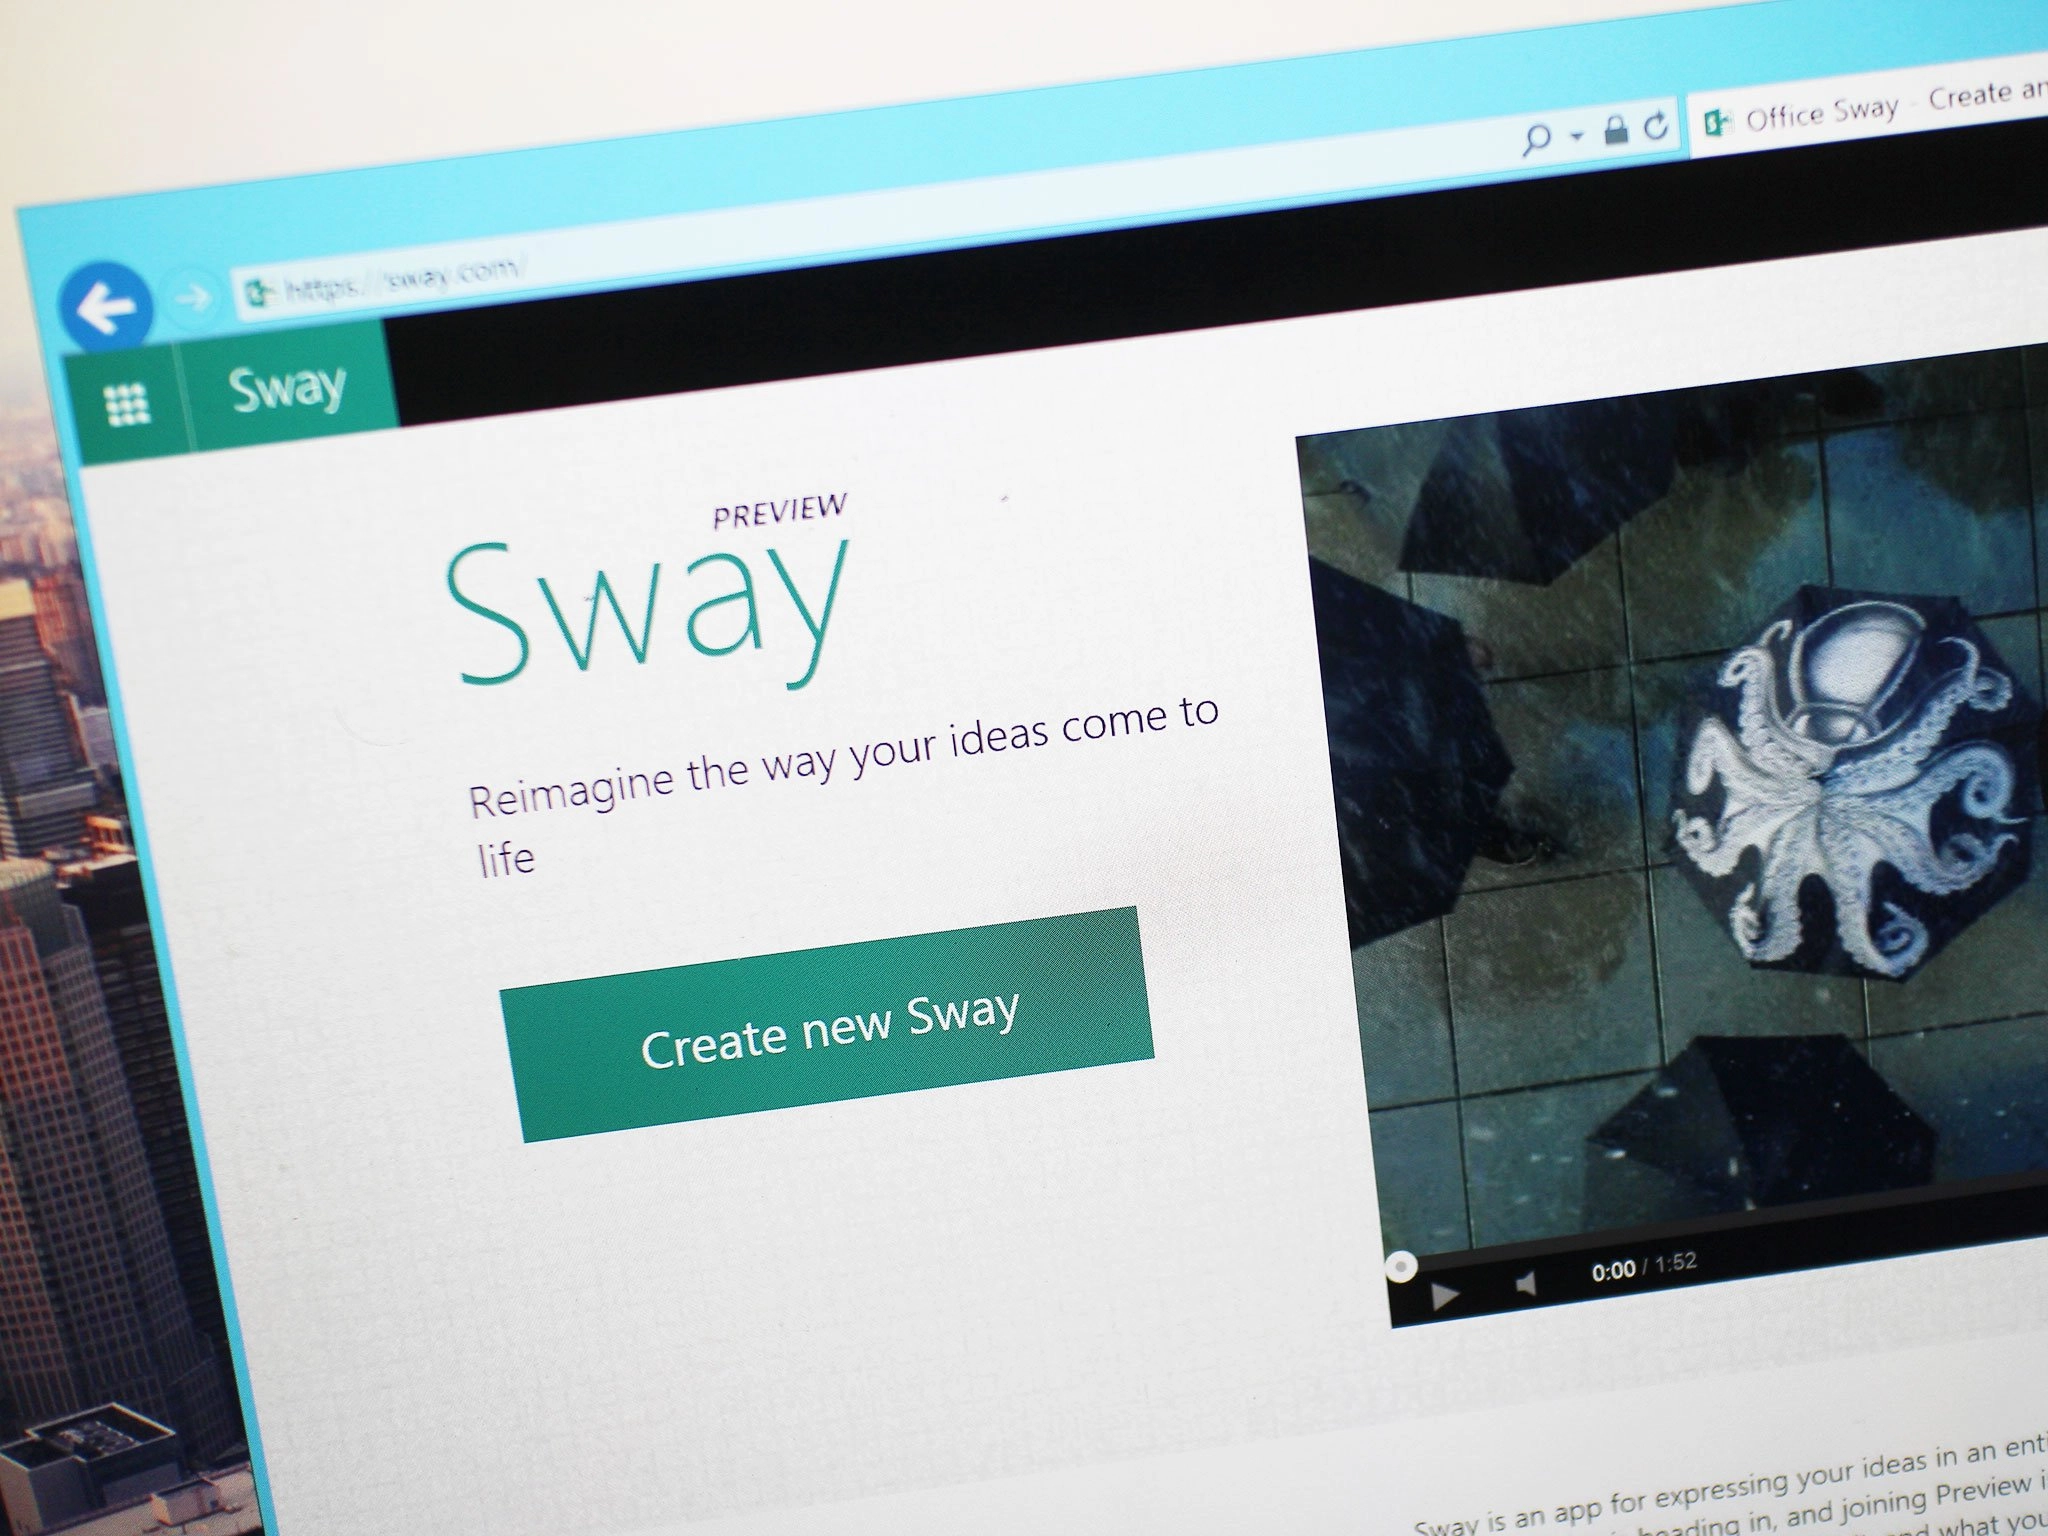
It's only been a few weeks since Microsoft last updated its Sway online presentation tools but today the company announced that it has added even more features to Sway. Among them is the ability to put in interactive charts and graphs.
The interactive charts features is still labeled as a "preview" but Microsoft said it wanted to get it out so it could receive feedback from users. It said:
"With the addition of native charts, it's easy to add a variety of interactive data visualizations to enhance your Sways—including column, stacked column, bar, stacked bar, line, pie, donut pie, area, stacked area and bar charts with people icons.
For photos in Sway, Microsoft is adding in what it calls Focus Points, which will allow presentation creators to tell Sway what to focus on when the tools do their automatic cropping. Microsoft says:
Now, you might be wondering: why doesn't Sway just have crop handles and let me manually specify exactly how to crop the image? Well, because Sway continuously adapts the formatting to make sure your creation looks great on any screen, manual image cropping isn't as intuitive as it seems. If you crop a picture, you very specifically set the dimensions. But what would this mean when you hit Remix!, change the style or layout, or view your Sway on a different device? It would mean Sway wouldn't be as flexible to adapt your design to look great on any screen. We may eventually add manual cropping as an override, but for now, Focus Points lets you get the image cropping you intend while still letting the magic of Sway make your creation look great.
Microsoft has also made it easier to embed Word, PowerPoint, Excel and PDF files in Sway presentations and added a new text highlighting tool called Accent. You can learn more about these new features at Microsoft's Office blog.
Source: Sway

