Windows Phone Marketplace statistics after one year

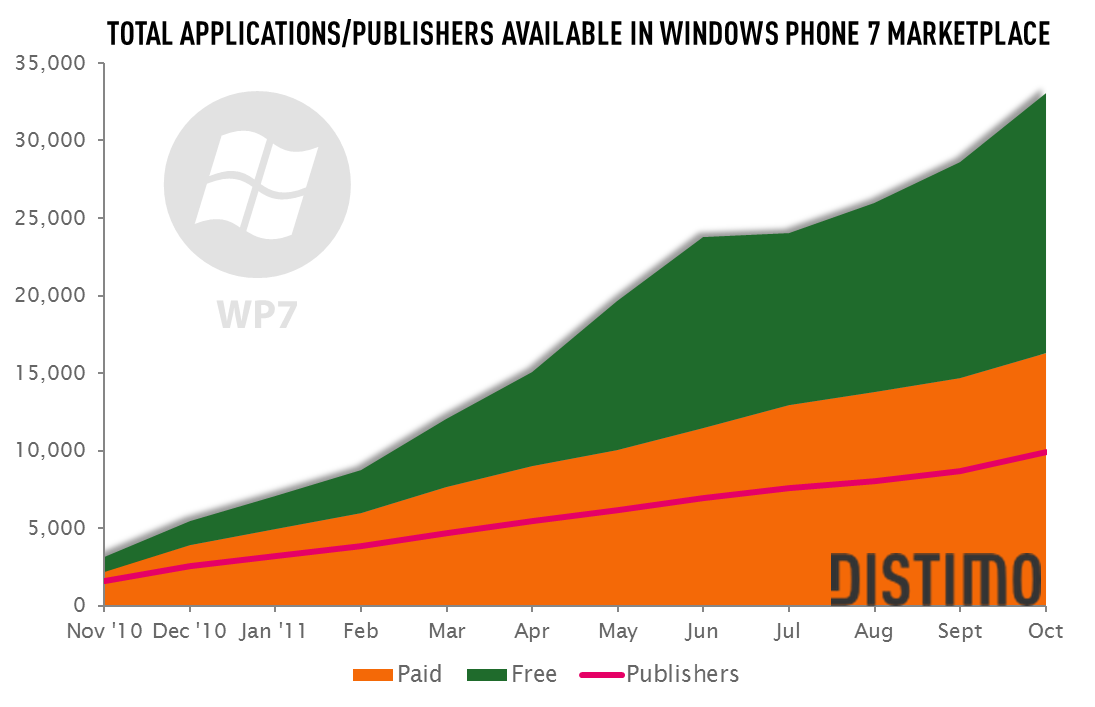
We've been following the Marketplace closely since the platform officially launched in October of last year. The statistics has always made us quietly giggle to ourselves with the growth Windows Phone has witnessed in terms of quality apps being submitted and developers establishing themselves compared to Android and iOS. Distimo, a mobile analytics firm, has published Marketplace data in some pretty charts and graphs. Starting with the image above, we can see the steady growth of the Marketplace, which is well on its way to the 50,000 marker, and compare the increase of paid and free apps with the number of publishers.
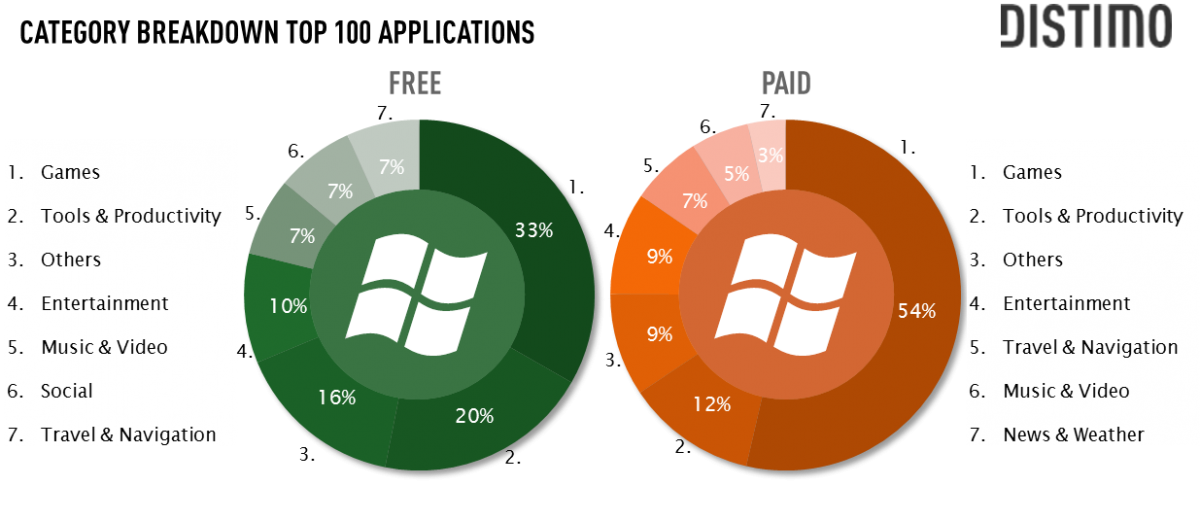
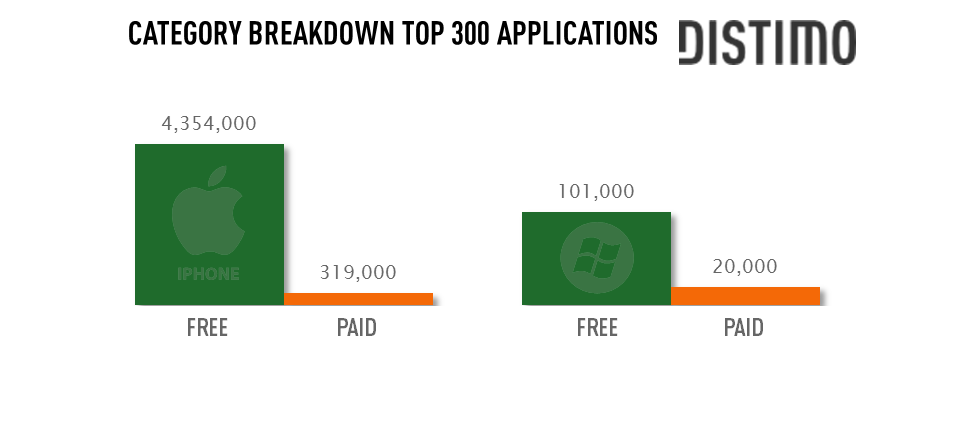
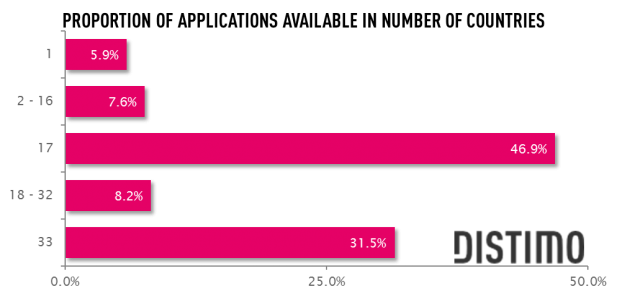
From launch 70% of available apps were paid, and this trend continued until early this year where an influx of free apps stormed the Marketplace - accompanied by spam. You'll notice a growth halt between June and July this year, which was due to Microsoft decreasing the number of apps a developer can publish a day with similar functionality. Check out a few more charts after the break that run through app breakdown, the comparison of downloads between Apple and Windows Phone with top 300 free and paid apps, and the number of apps available in countries.
Source: Distimo, via: TechCrunch
All the latest news, reviews, and guides for Windows and Xbox diehards.

Rich Edmonds was formerly a Senior Editor of PC hardware at Windows Central, covering everything related to PC components and NAS. He's been involved in technology for more than a decade and knows a thing or two about the magic inside a PC chassis. You can follow him on Twitter at @RichEdmonds.


