How to track GPU performance data on Windows 10
Task Manager now displays performance data about your graphics cards, and in this guide, we'll tell you how to view and understand this information.
Starting with the Windows 10 Fall Creators Update, the Task Manager introduces the ability to track Graphics Processing Unit (GPU) performance data to understand better how these resources are being utilized, now that GPUs are becoming increasingly important in computing.
This means that every GPU configured on your computer will now appear within the "Performance" tab displaying real-time resources utilization. Also, in the "Processes" tab, you can now see which processes are actively accessing the graphics processor, as well as video memory analytics in the "Details" tab.
In this Windows 10 guide, we'll walk you through the steps to check and get started tracking GPU performance data using Task Manager.
Article continues below- How to check if GPU performance will appear in your PC
- How to track GPU performance using Task Manager
How to check if GPU performance will appear on your PC
Although Task Manager doesn't have any special requirements to monitor system resources, such as the processor, memory, storage, and network adapters, things are a bit different to expose GPU information.
On Windows 10, the GPU information is available in Task Manager using the Windows Display Driver Model (WDDM), which is a special driver architecture that video cards must support to render the desktop and apps on the screen.
Inside WDDM, there's the Graphics Kernel that includes a scheduler (VidSch) and video memory manager (VidMm), which are responsible for making decisions about using GPU resources.
Task Manager gathers the GPU performance data directly from the Graphics Kernel's scheduler and video memory manager for both integrated and dedicated GPUs, but in order to work version 2.0 or later of WDDM is required.
All the latest news, reviews, and guides for Windows and Xbox diehards.
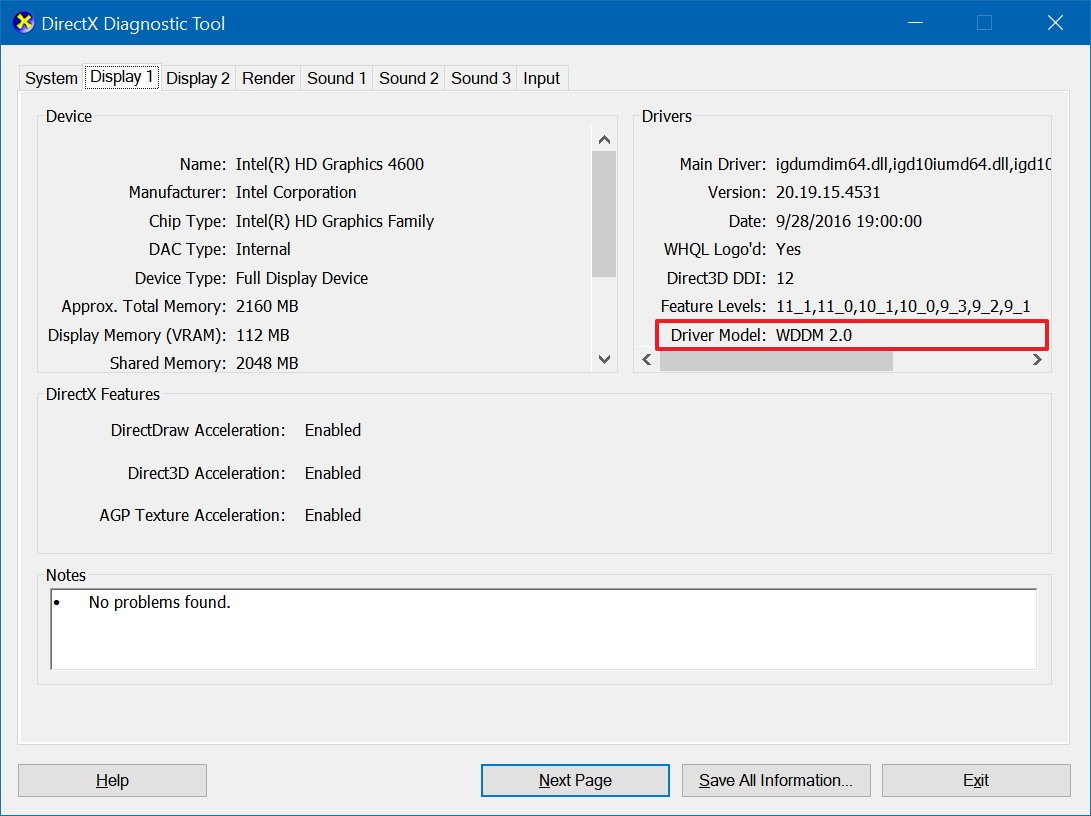
To check if your device supports GPU performance data in Task Manager, do the following:
- Use the Windows key + R keyboard shortcut to open the Run command.
- Type the following command to open DirectX Diagnostic Tool and press Enter:
dxdiag.exe - Click the Display tab.
- On the right, under "Drivers," check the Driver Model information.
If the Driver Model reads WDDM 2.0 or later, then Task Manager should list all your GPUs under the "Performance" tab.
How to track GPU performance using Task Manager
In order to track GPU performance data using the Task Manager, simply right-click the Taskbar, and select Task Manager. If you're in the compact mode, click the More details button, and then click the Performance tab.
Quick Tip: Using the old Ctrl + Shift + Esc keyboard shortcut will get you to Task Manager more quickly.
Performance tab
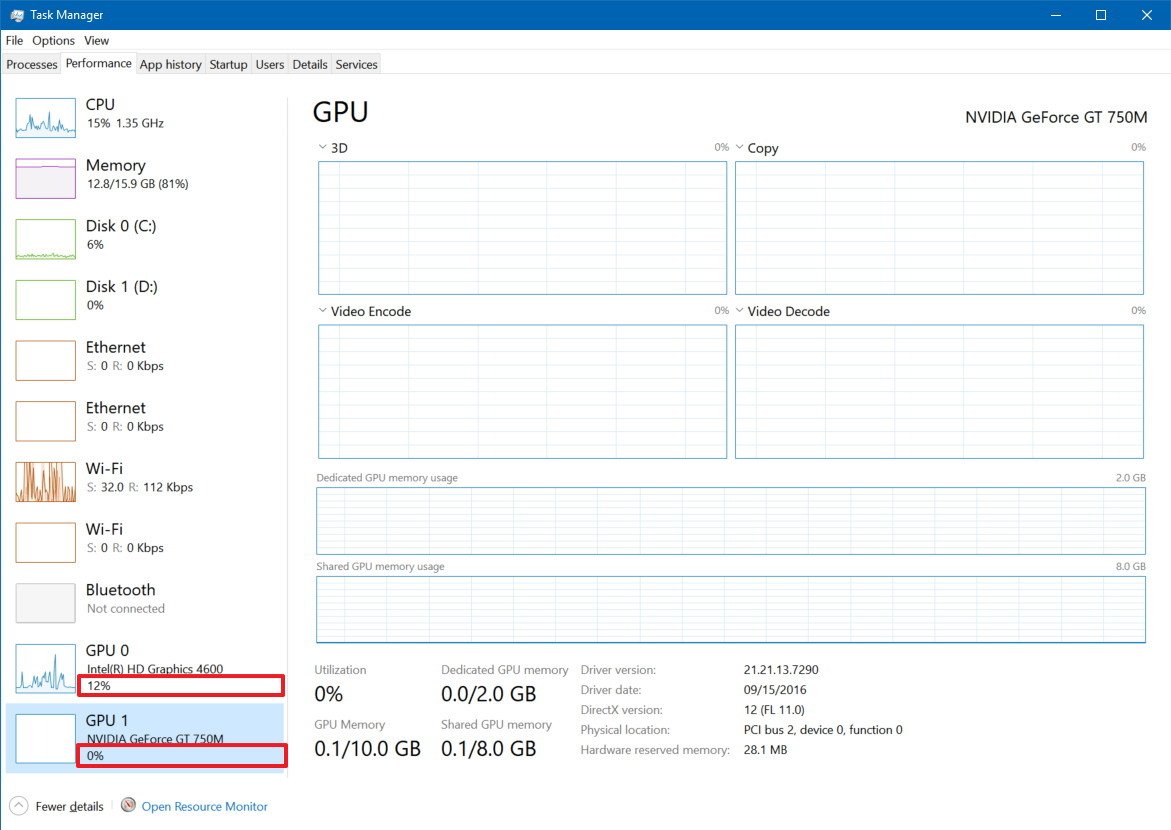
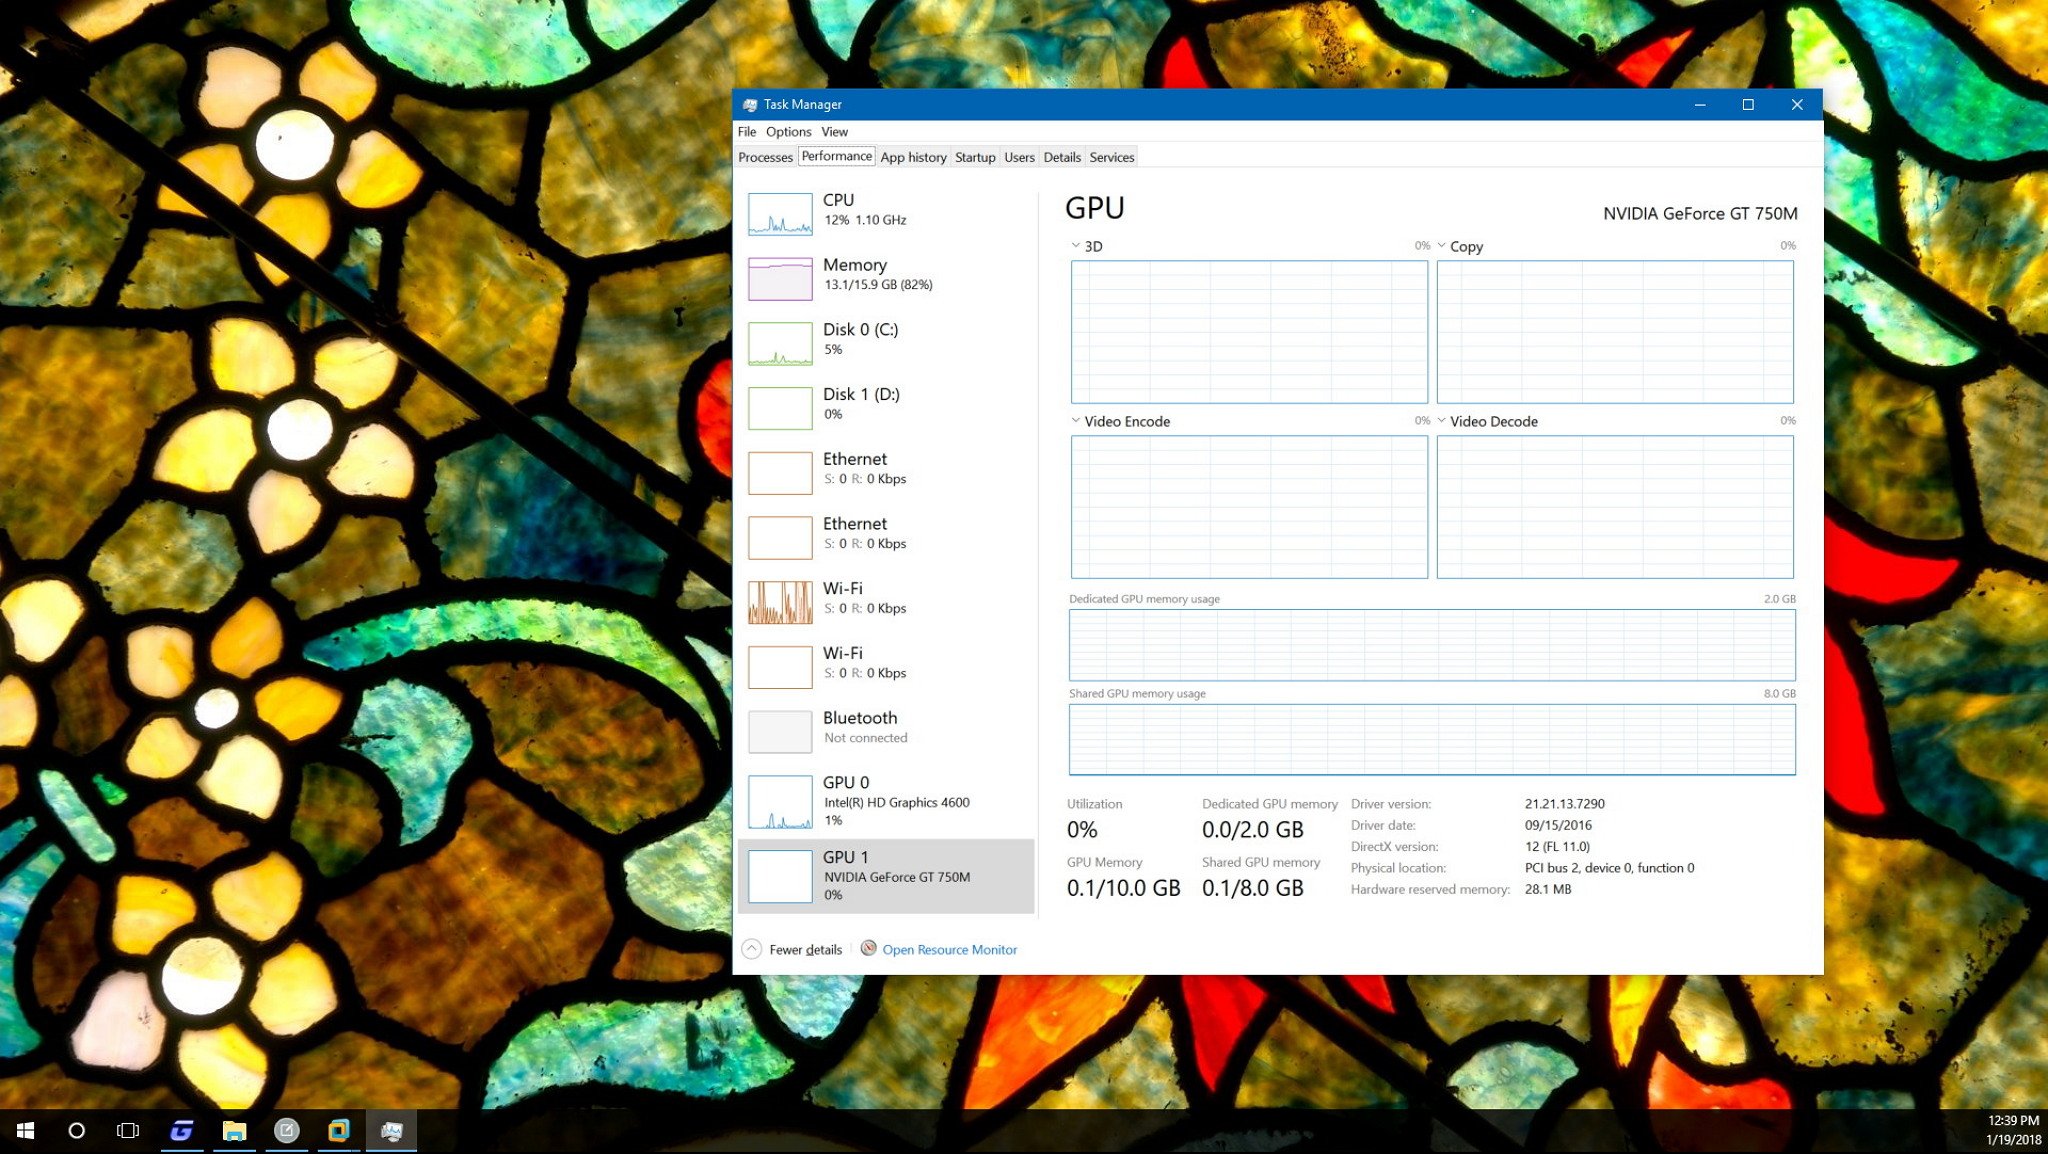
If your machine supports WDDM version 2.0 or later, the Performance tab will list your GPU in the left pane. In the case that you have multiple GPUs, each one will be named using a number that corresponds to its physical location. For example, GPU 0, GPU 1, GPU 2, etc.
Windows 10 also includes support for linking multiple GPUs using Nvidia SLI and AMD Crossfire. When one of these configurations are detected, the "Performance" tab will name each link using a number (for example, Link 0, Link 1, etc.), and you'll be able to see and inspect each GPU within the link.
GPU
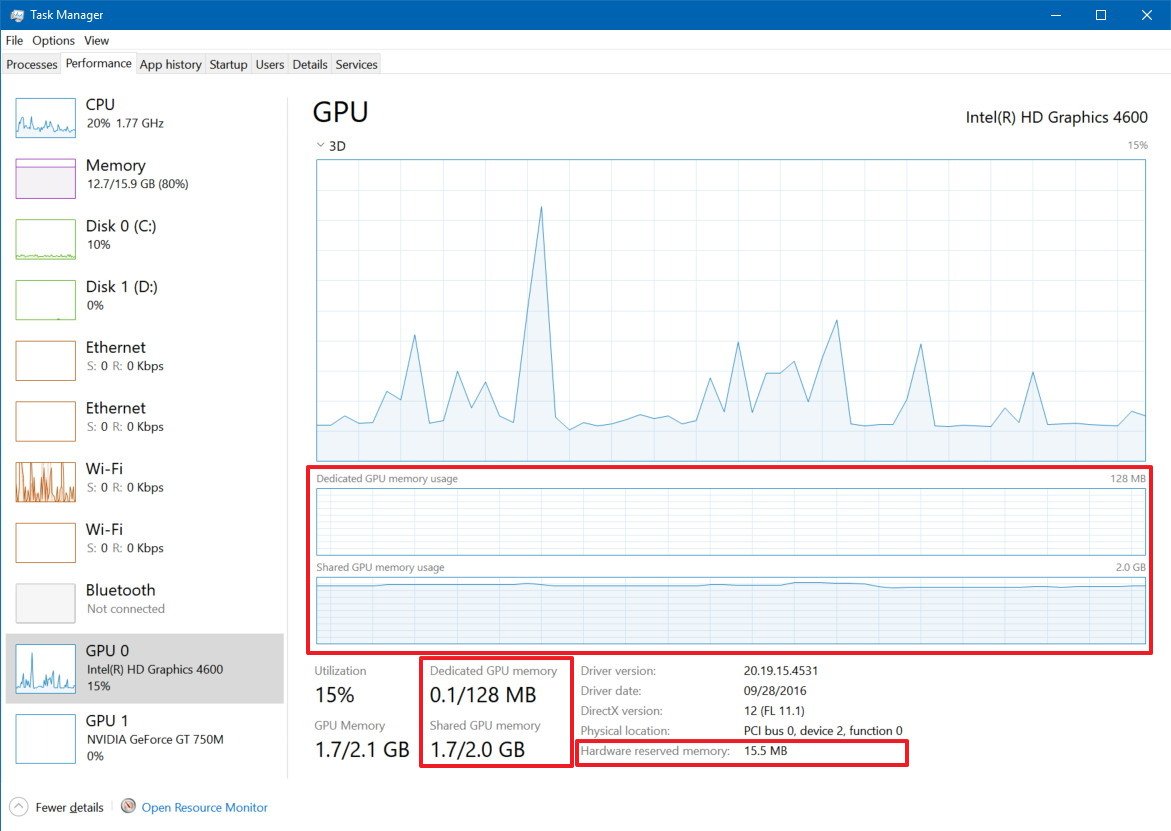
Inside the graphics card page, you'll find aggregated performance data mostly divided into two sections.
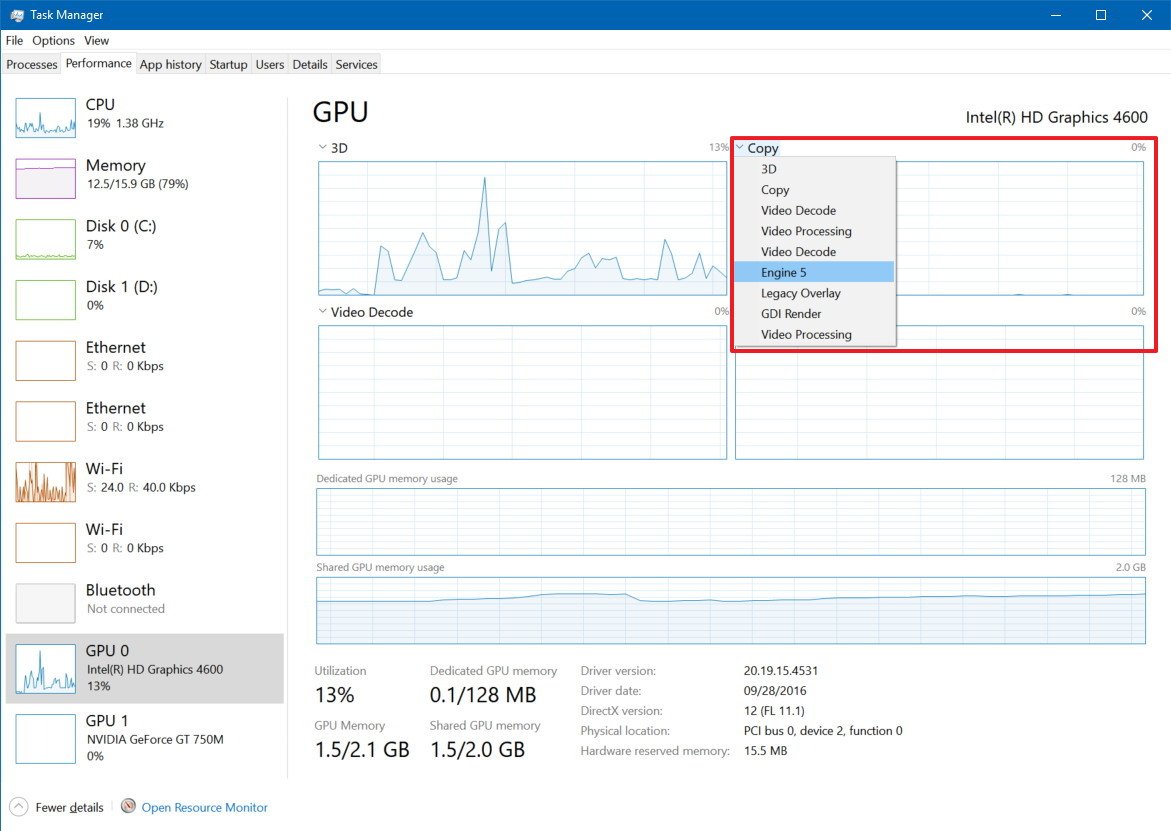
The GPU section includes current information regarding the GPU engines, not individual GPU cores. (It's worth to define that a GPU engine is made up of many GPU cores.)
Task Manager, by default, will display the four most interesting GPU engines, which typically can include 3D, Copy, Video Decode, and Video Processing, but you can change these views by clicking the name and picking another engine.
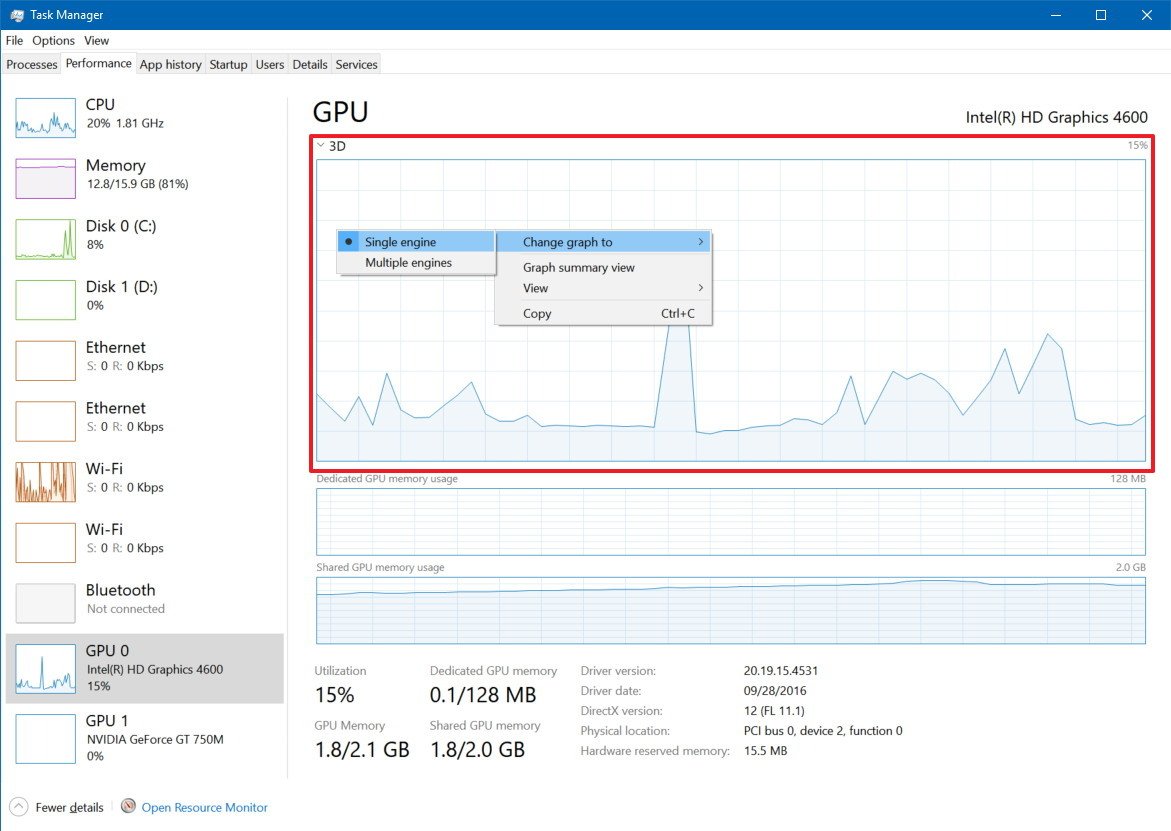
You can even change the graph view to a single engine by right-clicking anywhere within the section and selecting the Single engine option from the menu.
Memory
Immediately after the engines graphs, you'll find the video memory utilization and summary.
Task Manager shows two types of video memory, including dedicated and shared memory.
The dedicated memory is the memory that will only be used by the graphics card. Usually, this is your VRAM on discrete cards or the amount of memory a computer is configured to explicitly reserved for the integrated graphics card, but the CPU can still use it.
At the bottom right, you'll also notice the "Hardware reserved memory," which represents the amount of memory reserved for the video driver.
The amount of dedicated memory in this section represents the total amount of memory actively being utilized across the processes, while the amount of shared memory in this section represents the amount of system memory consumed for graphics.
Also, in the left pane, under the GPU name, you'll see the current total aggregated performance utilization. However, it's worth noting that Task Manager uses the percentage of the busiest engine to represent the overall usage.
To see performance data in action, run an application that makes real use of the GPU, or you can try playing a game.
Processing tab
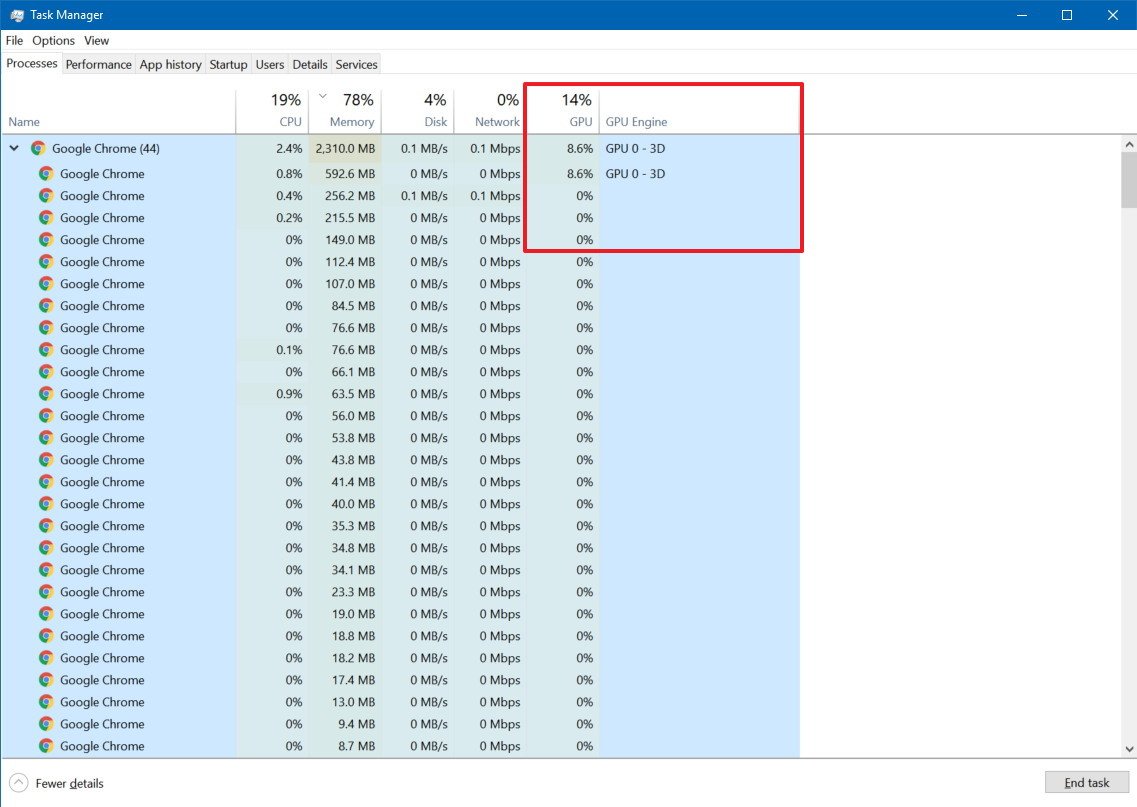
You can also track GPU performance through the "Processing" tab. In the section, you'll find an aggregated summary per-process currently running.
The GPU column shows the usage of the most active engine to represent the overall utilization for a particular process across all GPUs.
However, to avoid confusion if multiple engines report 100 percent utilization, there's a GPU Engine column that reports the exact GPU and engine utilized by the process in question.
Under the "Process" tab, at the top of the column, you'll also find the total of resource utilization combining every GPU configured on your device.
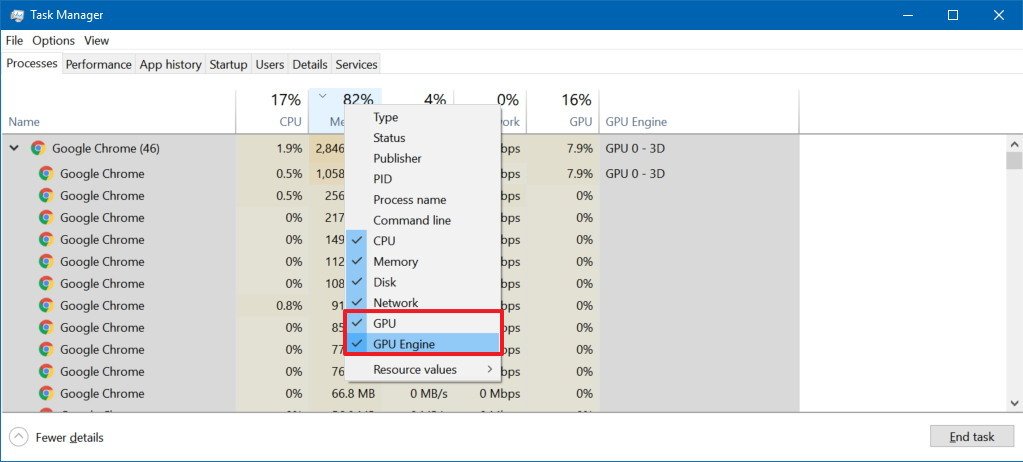
If you don't see these columns, right-click a column, and check the GPU and GPU Engine options.
Details tab
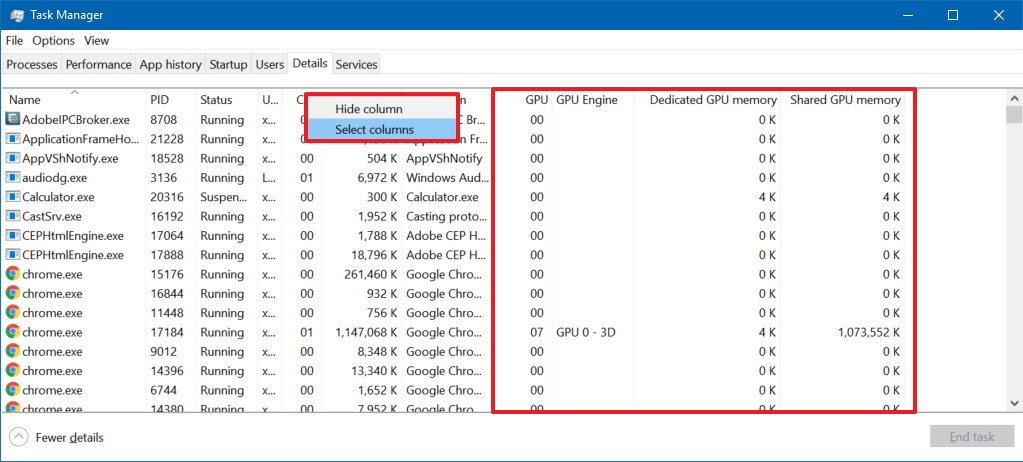
By default, the "Details" tab doesn't display any GPU information, but you can always right-click a column, click the Select columns option, and check enable these options:
- GPU.
- GPU Engine.
- Dedicated GPU memory.
- Shared GPU memory.
The memory columns display the total amount of shared and dedicated video memory currently being used by a particular process. The GPU and GPU Engine show the same information that the "Processing" tab provides.
When using the "Details" tab, you just need to be aware that adding the used memory by each process can end up being larger than the total available memory as the shared memory will be counted multiple times. This information is useful to understand the memory usage per-process, but you should be using the "Performance" tab to see a more accurate overall video utilization.
Wrapping things up
Although Microsoft says that Task Manager will provide users more accurate GPU performance data than third-party tools, it's worth noting that these changes are still a work in progress that the company plans to improve over time.
What do you think about GPU information now available in Task Manager? Tell us in the comments below.
More Windows 10 resources
For more helpful articles, coverage, and answers to common questions about Windows 10, visit the following resources:
- Windows 10 on Windows Central – All you need to know
- Windows 10 help, tips, and tricks
- Windows 10 forums on Windows Central

Mauro Huculak has been a Windows How-To Expert contributor for WindowsCentral.com for nearly a decade and has over 22 years of combined experience in IT and technical writing. He holds various professional certifications from Microsoft, Cisco, VMware, and CompTIA and has been recognized as a Microsoft MVP for many years.

 Windows Central Insider


