How to use Performance Monitor on Windows 10
You computer is suddenly slower than you remember. Here's how to use the Performance Monitor on Windows 10 to get to the bottom of the issue.
All the latest news, reviews, and guides for Windows and Xbox diehards.
You are now subscribed
Your newsletter sign-up was successful
Join the club
Get full access to premium articles, exclusive features and a growing list of member rewards.
When your computer suddenly isn't fast as usual, or keeps freezing up, you're likely dealing with performance issues that could be caused by a number of reasons. It could be as a result of problems with the hardware, apps or drivers poorly designed, the operating system using excessive system resources, or even be a malware that infected your device.
Although Windows 10 includes a number of tools to troubleshoot performance issues, such as the "Performance" tab in Task Manager, you'll find that the Performance Monitor is the most complete tool you can use to view and analyze application and hardware data to fix system performance related problems. You can also customize what data to collect in log files, define alerts, generate reports, and replay collected performance data in many ways.
In this Windows 10 guide, we'll walk you through the steps to use the Performance Monitor to analyze your computer's performance.
Article continues below- How to open Performance Monitor
- How to use Performance Monitor
- How to use Data Collector Sets
- How to use Reports
How to open Performance Monitor
On Windows 10, you can use Performance Monitor to analyze data, such as processor, hard drive, memory, and network usage, but first, you must know how to open the tool. Here are three ways to open Performance Monitor:
- Open Start, do a search for Performance Monitor, and click the result.
- Use the Windows key + R keyboard shortcut to open the Run command, type perfmon, and click OK to open.
- Use the Windows key + X keyboard shortcut to open the Power User menu, select Computer Management, and click on Performance.
How to use Performance Monitor
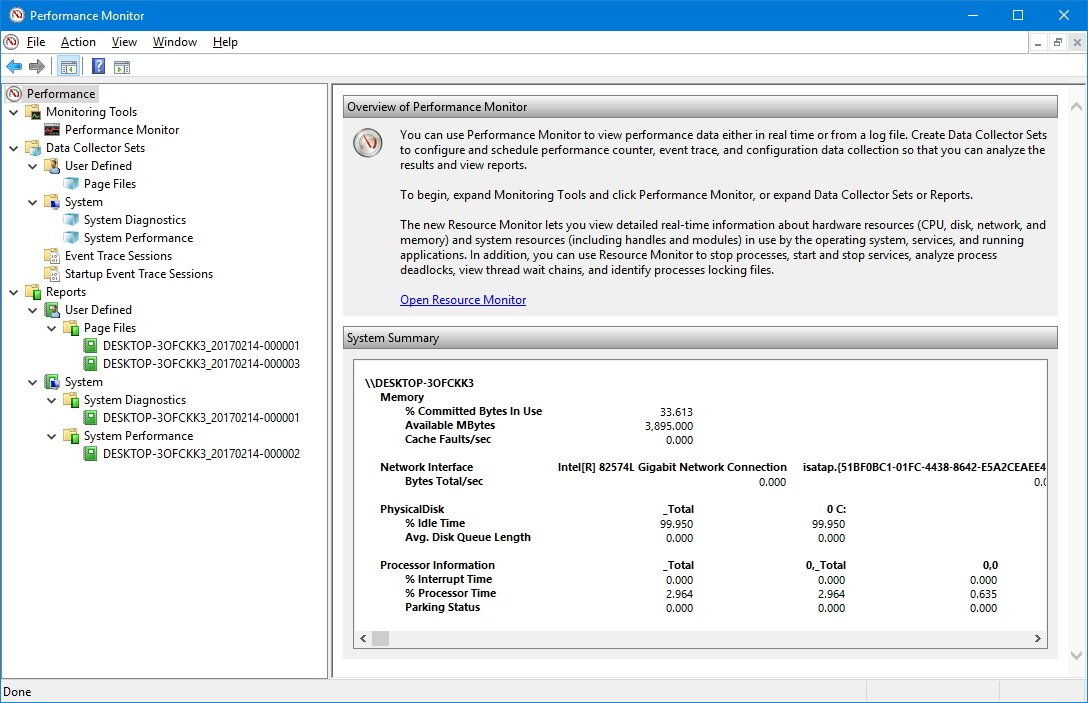
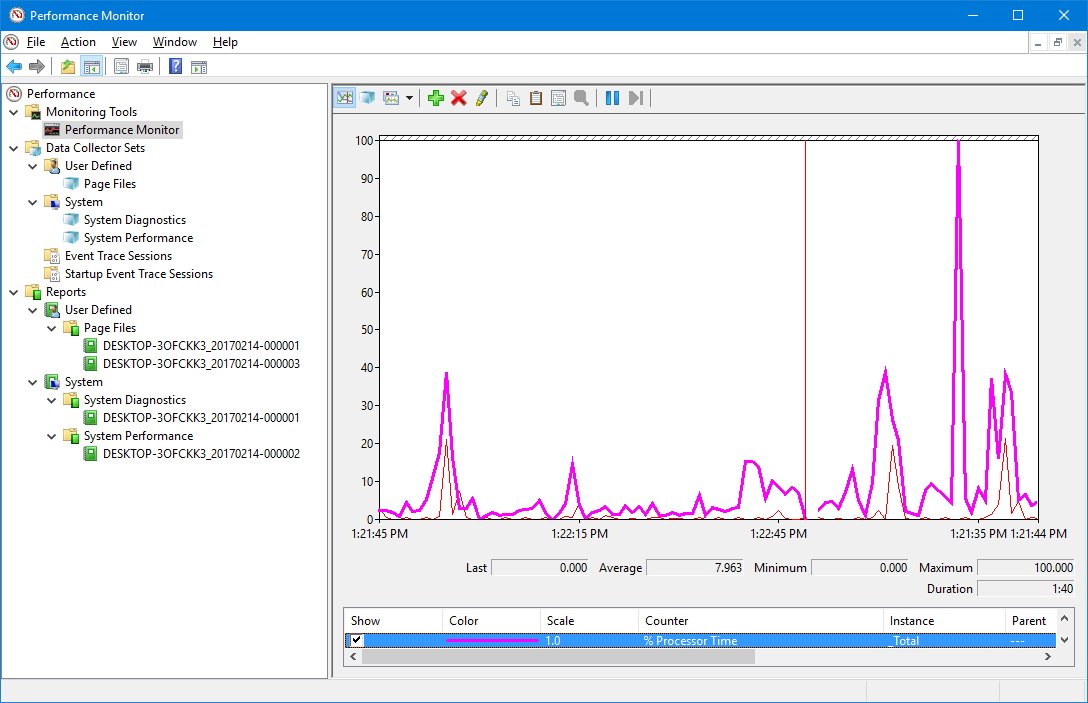
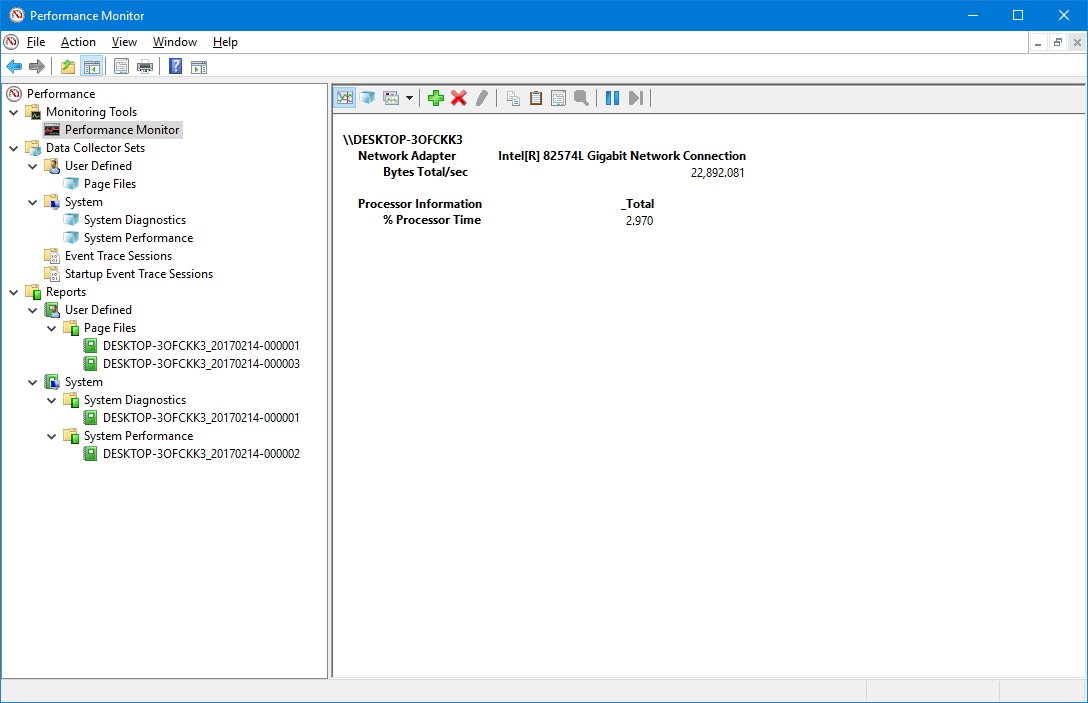
When you first open the tool, it'll open in the main page with a brief overview, as well as a system summary with real-time data about memory, network adapter, physical disk, and processor usage.
On the left, you'll find the navigation pane with access to Performance Monitor, Data Collector Sets, and Reports.
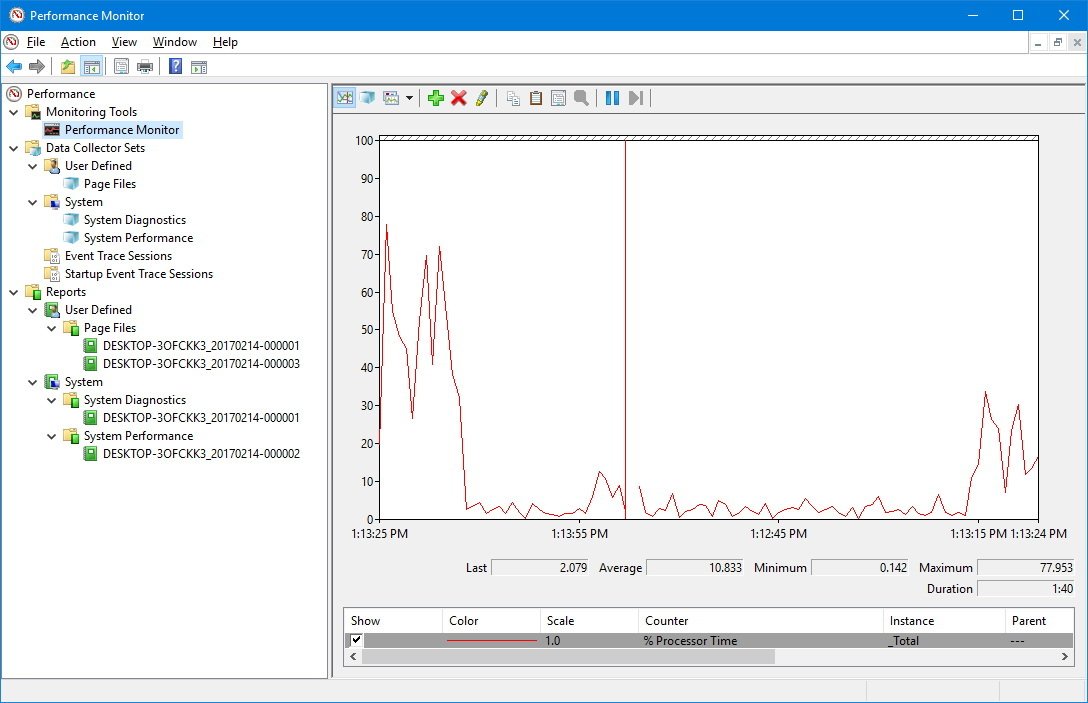
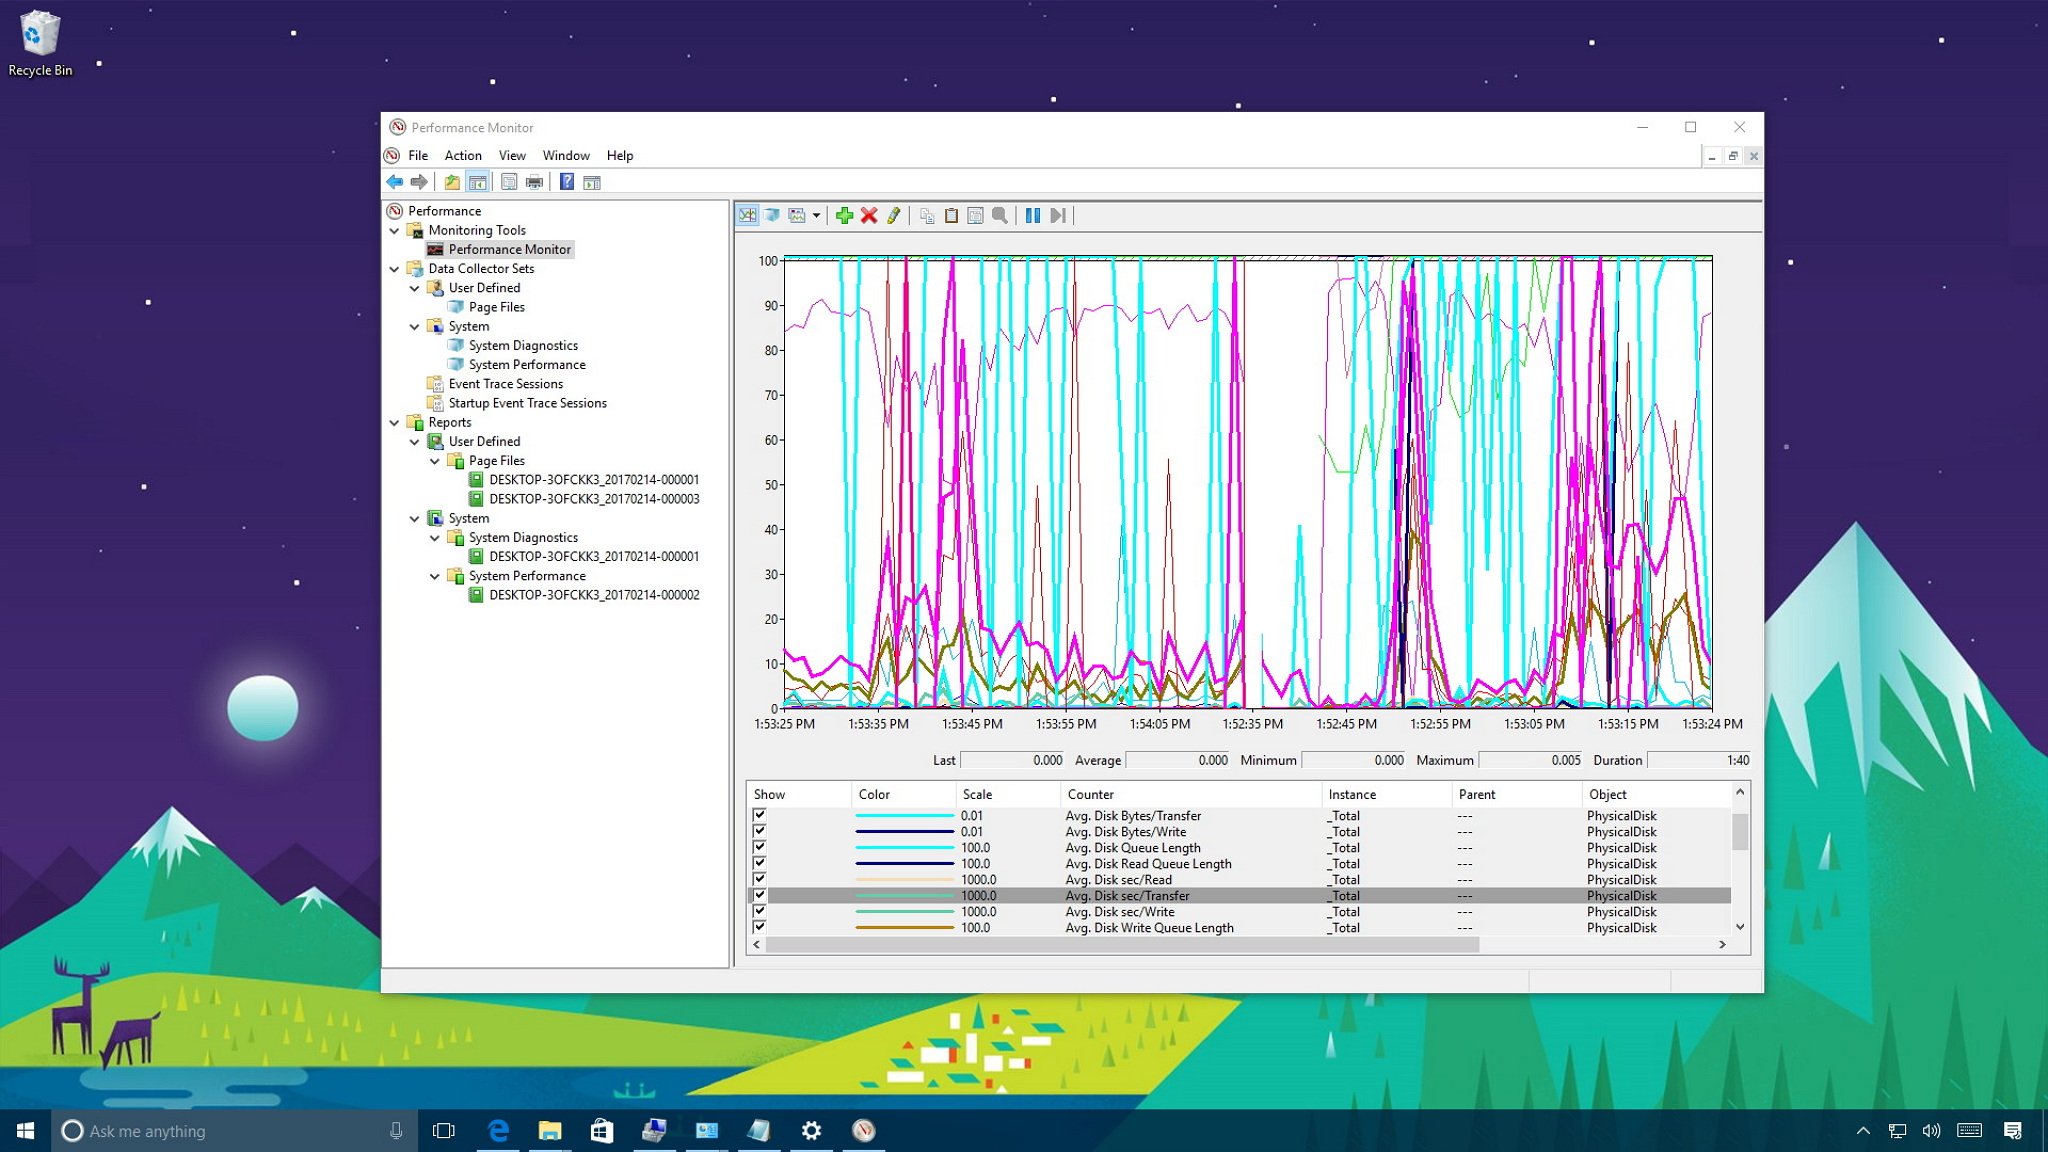
Switching to Performance Monitor, you'll see a screen with a single counter. This is typically the "Processor Time" counter, which displays the processor load in the last 100 seconds. However, the beauty of this tool is that you can add tons of other counters to monitor virtually anything on your computer.
All the latest news, reviews, and guides for Windows and Xbox diehards.
Adding new counters
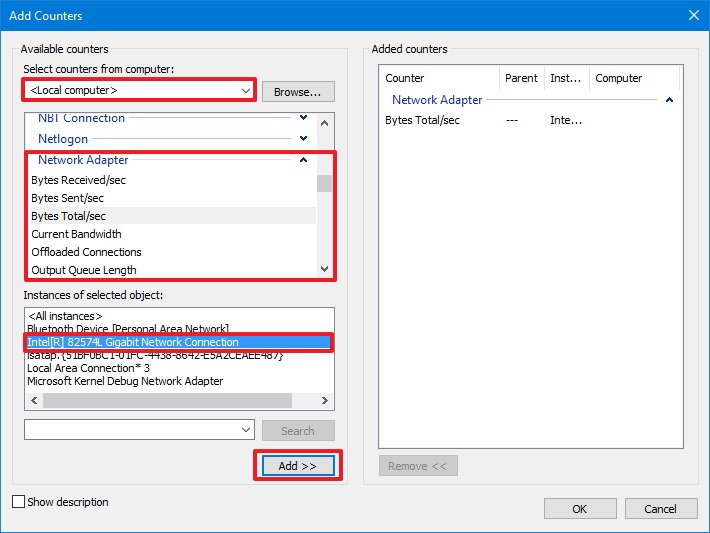
To add new counters to monitor applications and hardware performance on your computer, do the following:
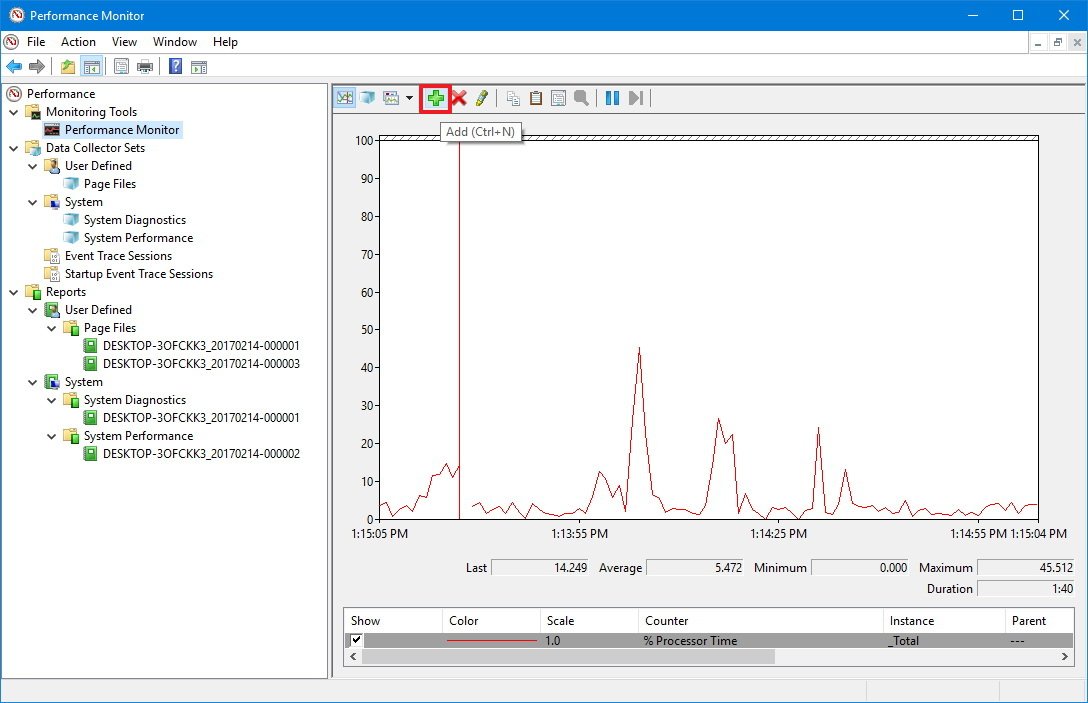
- Click the green plus button above the Performance Monitor graph.
- Select Local computer or the name of your computer from the drop-down menu.
- Select and expand the category of the item you want to monitor. For example, for the purpose of this guide, select the "Network Adapter" category.
- Select the counters you want to monitor (e.g., Bytes Total/sec).Quick Tip: If you're trying to add multiple counters, press and hold the Ctrl key and click to select each item you want to add. Also, you can check the Show description option to get more information about the counter you're selecting.
- If applicable, select the instances you want to monitor. For example, on Network Adapter, you can monitor one or multiple network adapters simultaneously.
- Click the Add button.
- Click OK to confirm and add the new counters.
Customizing Performance Monitor view
Once you have configured all the counters you want to monitor, you can also customize various aspects of the data shown in the graph.
To customize the Performance Monitor view, do the following:
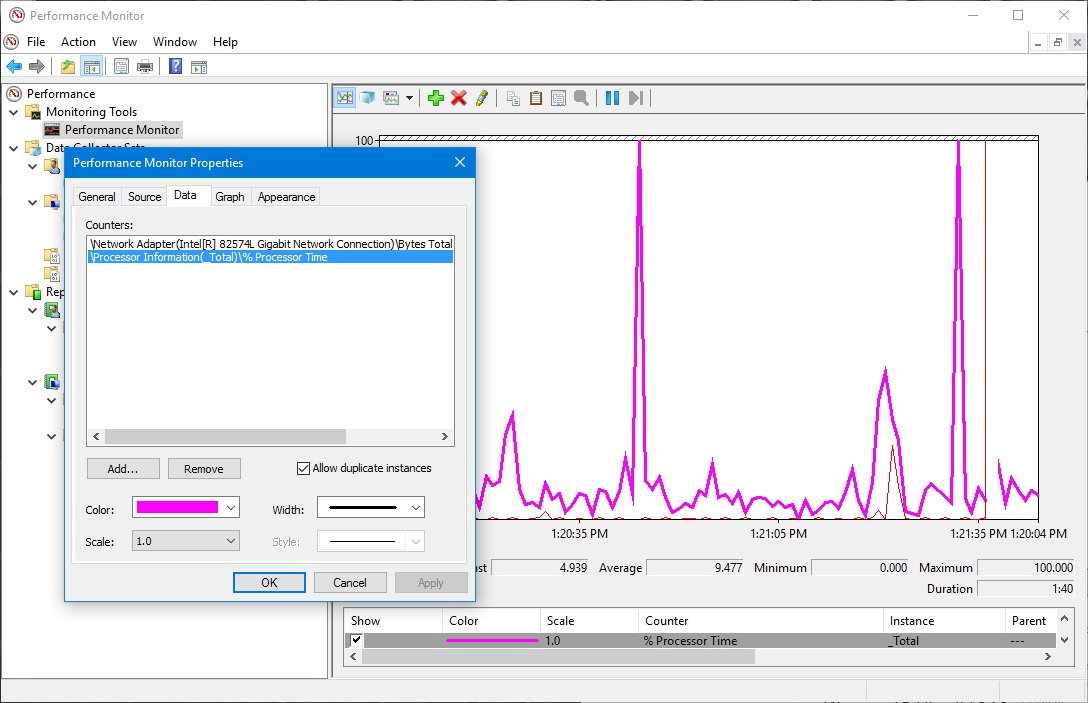
- Double-click one of the counters to open the Performance Monitor Properties window.
- On the "Data" tab, select the counter you want to customize.
- At the bottom, choose the color, scale, width, and style you want to use.
- Repeat steps 2 and 3 for each item you want to customize.Quick Tip: If you're trying to change the properties for multiple counters, press and hold the Ctrl key, select each item you want to customize, and change the available settings.
- Click Apply.
- Click OK.
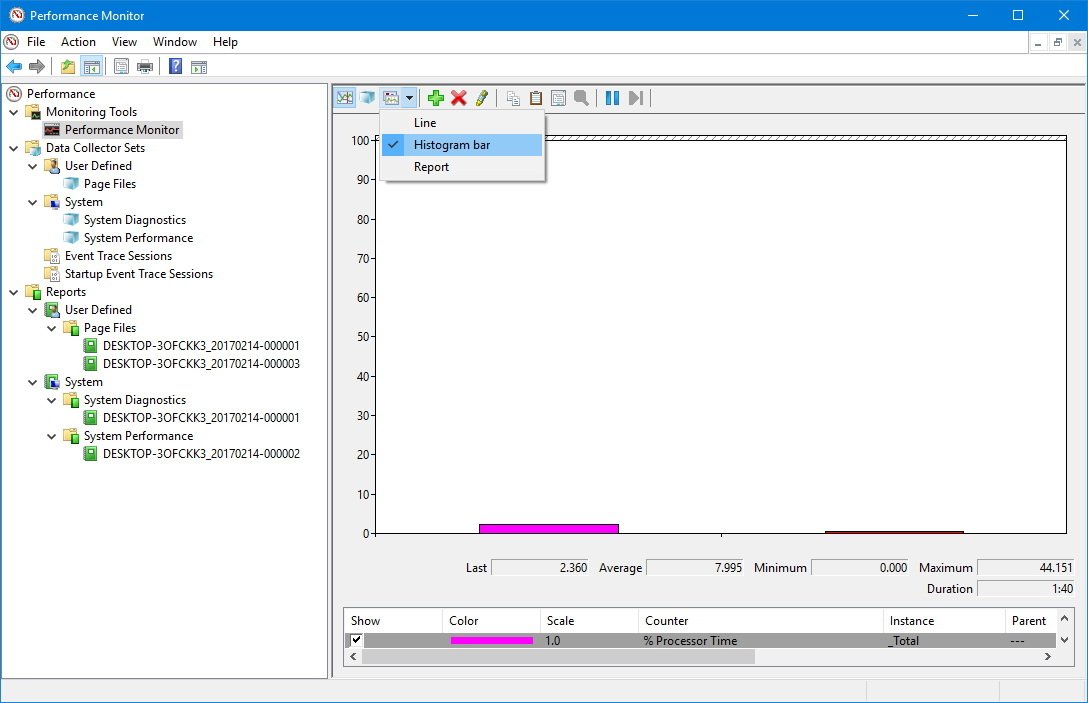
In addition, you can also change the graph's style, simply click the "Change graph type" in the toolbar and select one of the available views, including Line, Histogram bar, and Report.
Other options available in the toolbar include the ability to remove and highlight counter, and an option to freeze the display to analyze the current data on the screen.
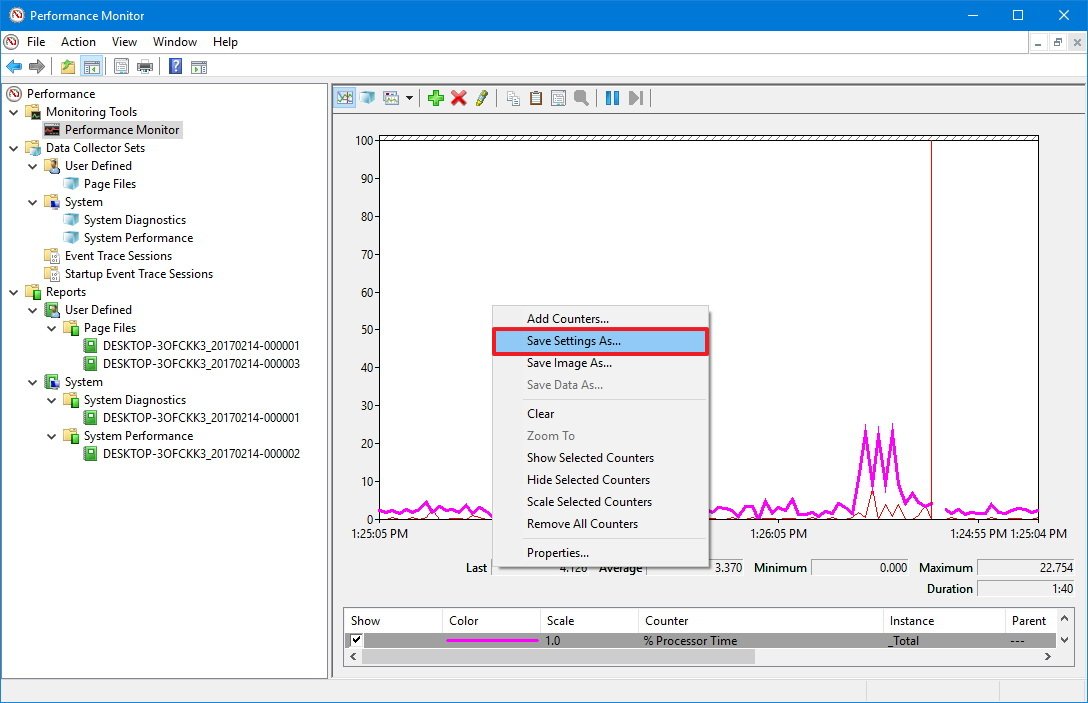
If you look at the context menu, you'll also see the "Save Settings as" option, which comes in handy when you want to save the counters and configuration for later use. Interesting enough, once you save the settings as an HTM file, you won't be able to load the configuration with Performance Monitor.
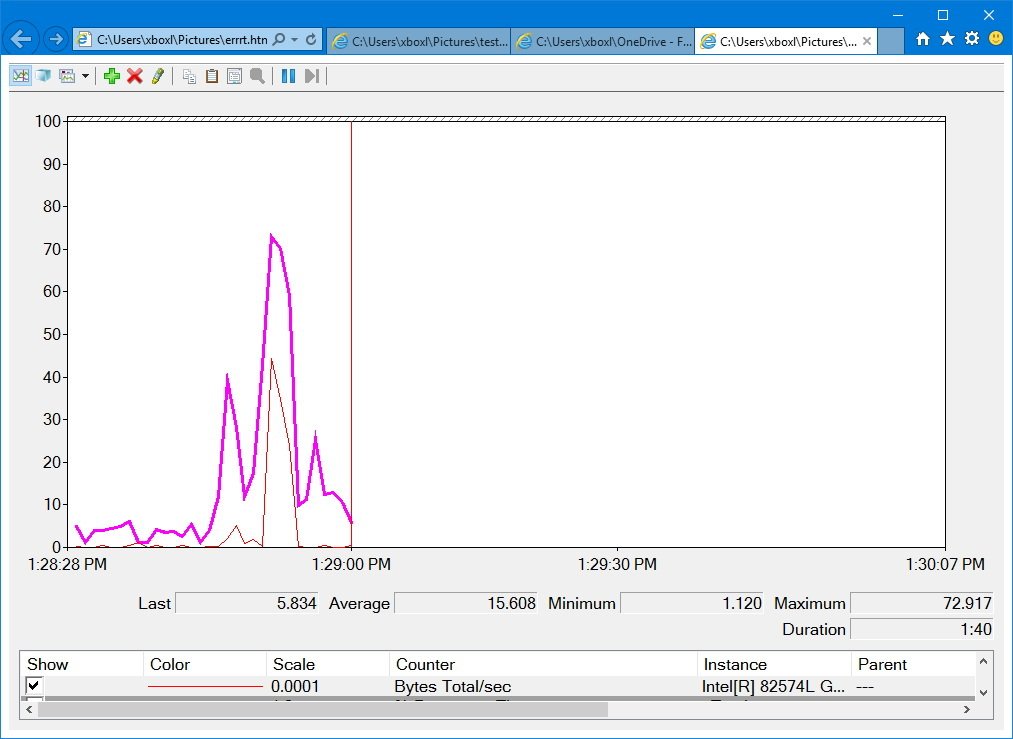
However, you can open the file using Internet Explorer, which actually loads a fully functional instance of Performance Monitor in the web browser.
Alternatively, you can open the settings file with Notepad and copy its content. Then you can open Performance Monitor and click the Paste Counter List (Ctrl + V) button in the toolbar to load your saved settings. (This option may not work for everyone.)
Performance Monitor counters
Now that you have a basic understanding of what's Performance Monitor and how to set it up let's look at some common counters you can use to monitor your system.
Physical Disk
Includes the counters to monitor the physical performance of your computer's hard drive.
You can select counters, such as % Disk Time to monitor the time a drive is taking to complete read and write requests. If this counter stays in high numbers for a long time, it could be an indication that the hard drive is ready for replacement.
Adding other counters like Disk Bytes/sec, Disk Read Bytes/sec, Disk Read/sec, Disk Write Bytes/sec, and Disk Writes/sec can help you to figure out the read and write speeds of the hard drive.
Processor
Includes the counters to monitor the processor activity.
You can select counters, such as % Interrupt Time to monitor the time the CPU takes to complete hardware requests (interrupts). If this counter stays above 30%, it could be an indication that there is a hardware problem.
Add the % Privileged Time counter monitors the time the processor is using to execute in Kernel (Privileged) mode. A high percentage of privileged time may indicate a poorly written driver or hardware malfunction.
Network Adapter
Includes a number of counters to monitor the sent and received bytes for one or multiple network adapters.
You can select counters, such as Bytes Received/sec, Bytes Sent/sec, Bytes Total/sec to see how much bandwidth is being utilized by your wireless or Ethernet adapter. If you're always downloading files or streaming high-resolution videos and bandwidth is consistently hitting 85%, you may want to consider upgrading your data speed plan.
However, if you're not using your internet connection heavily, but you still see high network activity, it could be a sign of something not working correctly, or it could also be a malware hidden on your computer.
Memory
Includes an array of counters to monitor your PC's RAM usage.
You can select counters, such as % Committed Bytes in Use to monitor the total memory currently in use by your system. If the number is continuously greater than 80%, then you don't have enough memory on your system.
Adding the Available Mbytes, you can measure the amount of physical memory, available for running processes. If this value is less than 5% of the total RAM installed on your computer, then you may need to add more memory.
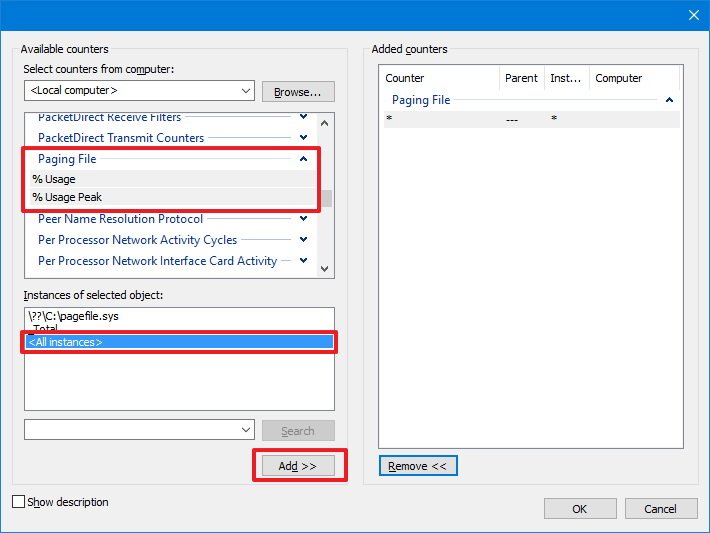
Page File
Includes counters to monitor how page files are being utilized.
If your computer is slow and the page file counters (% Usage and % Usage Peak) are constantly high. It could be an indication that you need to upgrade your computer's memory.
How to use Data Collector Sets
The Performance Monitor also includes Data Collectors Sets, which is where you can create custom sets containing performance counters and alerts based on specific criteria.
Creating a custom Data Collector Set
If you want to create custom Data Collector Set when to collect specific performance information, do the following:
- While in Performance Monitor, expand Data Collector Sets.
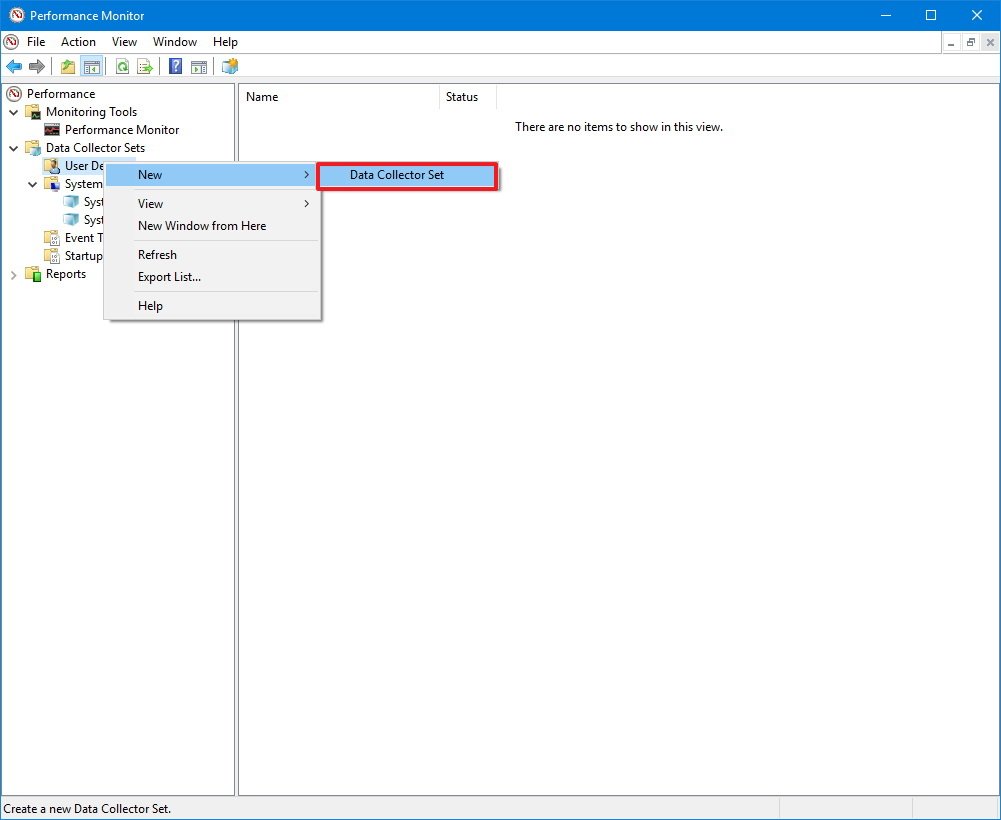
- Right-click "User Defined", select New, and click on Data Collector Set.
- Type a descriptive name for the new set.
- Select the Create manually (Advanced) option.
- Click Next.

- Select Create data logs and check the Performance counter option, but notice that you can also use other options as needed.
- Click Next.
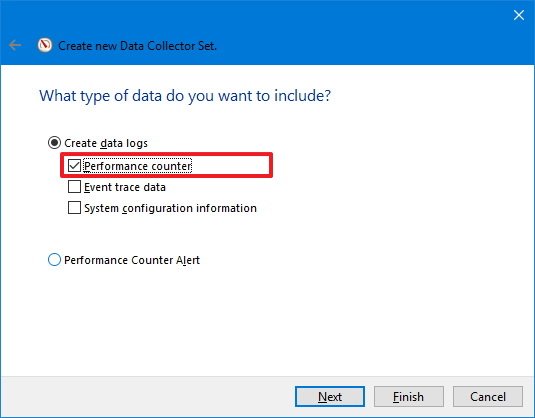
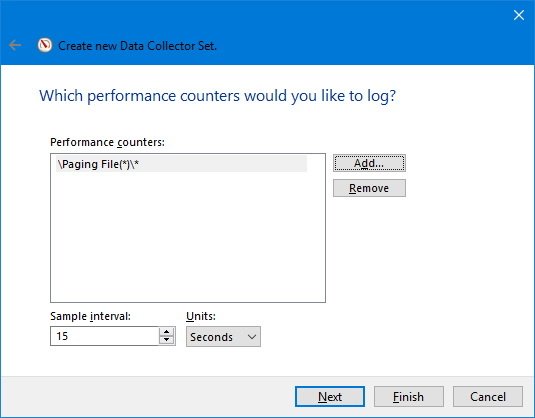
- Click the Add button.
- Pick and add the performance counters you want.
- Click OK.
- Configure the sample interval, which defines how often Performance Monitor will run and collect data. (Shorter intervals ensures that counters log information more frequently.)
- Click Next.
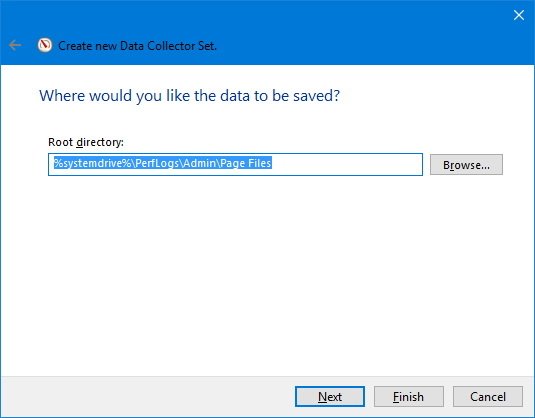
- You can leave the default settings or save your set in another location.
- Click Next.
- The set will run automatically no matter who is signed into Windows 10, but in this step, you can choose a specific user.
- Check the Save and Close option.
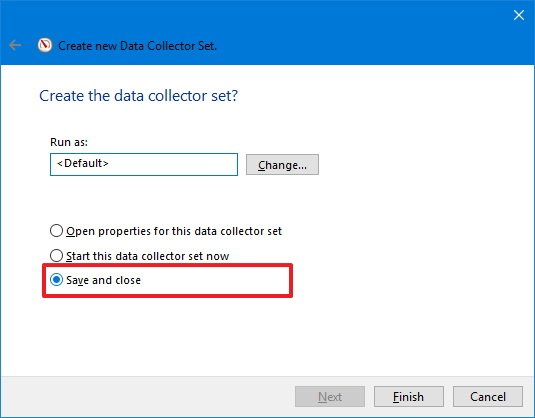
- Click Finish.
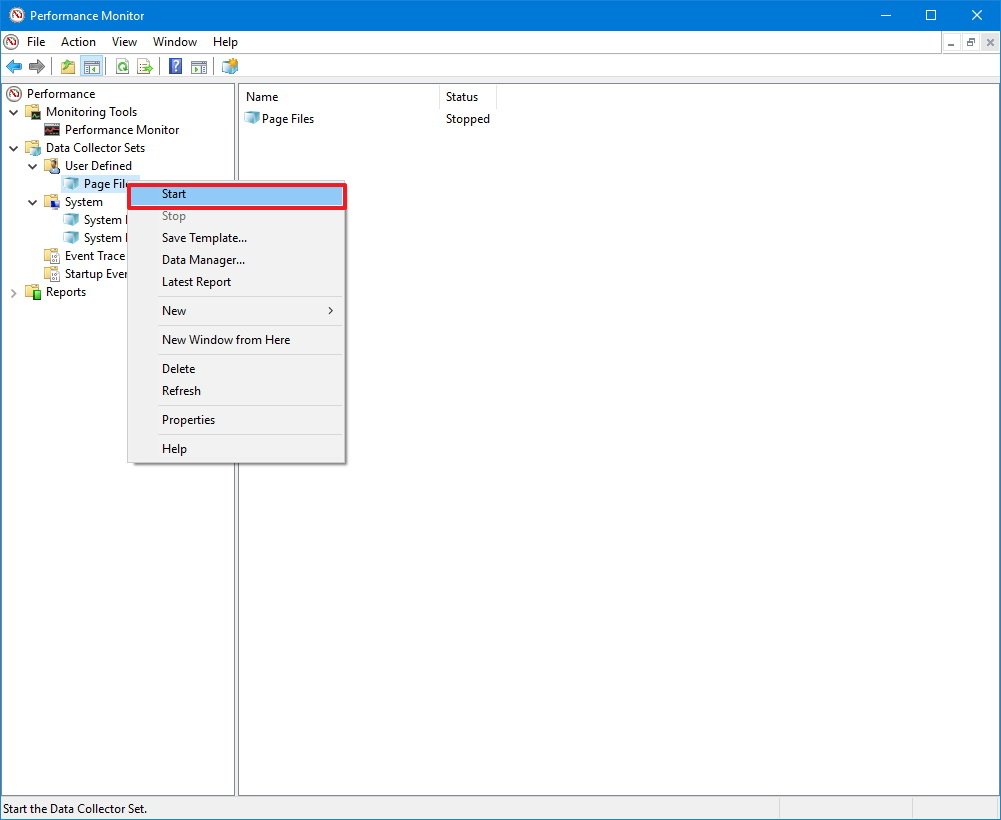
Once you completed the steps, you can right-click your Data Collector Set under "User Defined," and click Start to run it or Stop to shut it down.
Customizing a custom Data Collector Set
The wizard will only let you configure some of the settings when creating a custom Data Collector Set. If you want your custom set to stop automatically after a period of time, or run it on schedule, you'll need to manually configure those options.
To allow a set to stop automatically after a period of time, do the following:
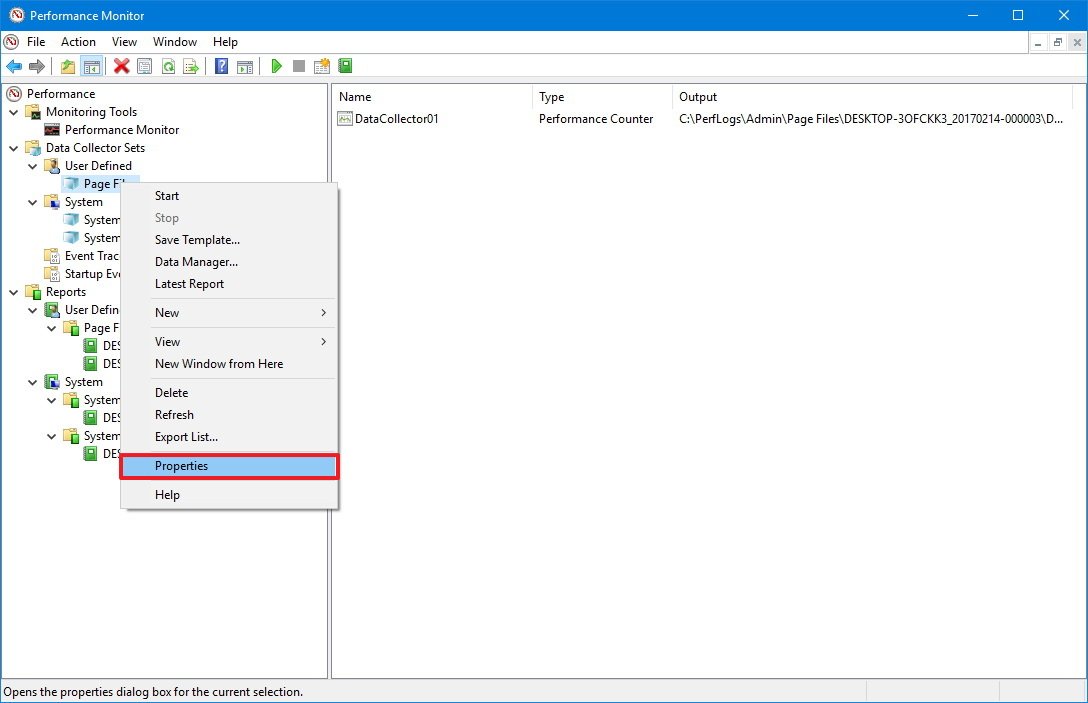
- Right-click the Data Collector Set you want, and select Properties.
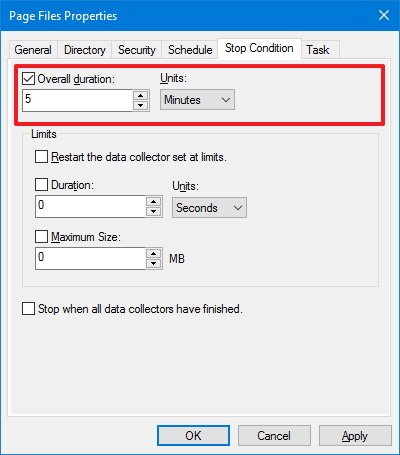
- Click on the Stop Condition tab.
- Check the Overall duration option.
- Define the time duration (e.g., 5 minutes).
- Configure the limits as needed.
- Click Apply.
- Click OK.
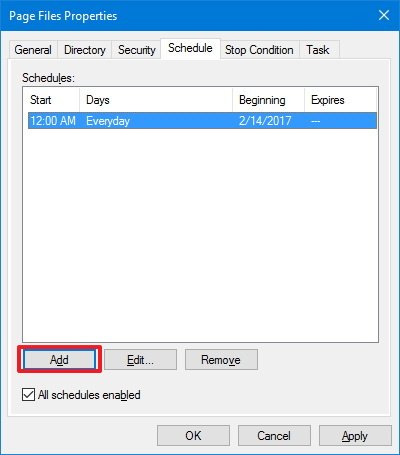
To schedule a set to run automatically, do the following:
- Right-click the Data Collector Set you want, and select Properties.
- Click on the Schedule tab.
- Click the Add button.
- On "Folder Action," define the schedule you want.
- Click OK.

- Click Apply.
- Click OK.
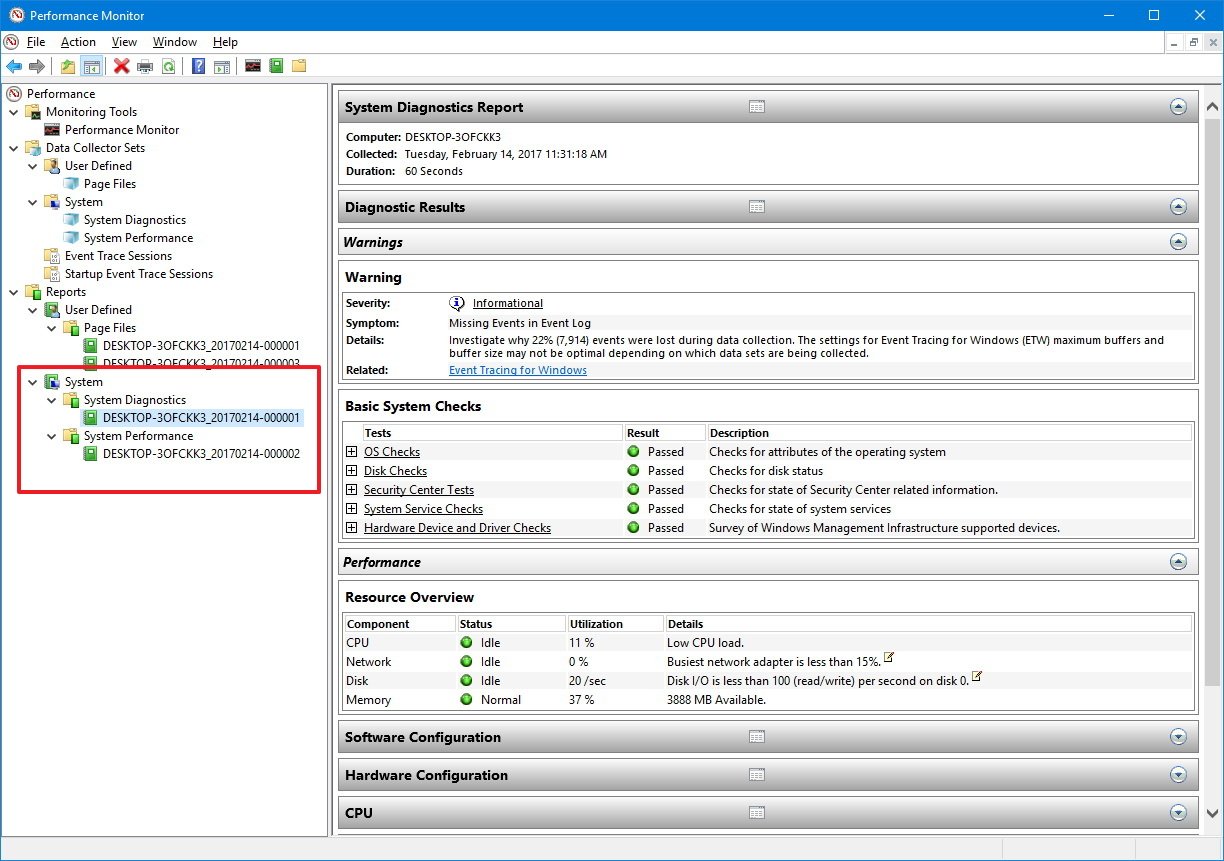
Alongside the ability to create your own sets, Windows 10 bundles two custom Data Collectors Sets to analyze performance, which are located inside the System folder.
- System Diagnostics: Collects various detailed system information, and it includes the counters found in System Performance.
- System Performance: Collects valuable performance data about the processor, hard drive, memory, and network adapters on your computer.
How to use Reports
You can view and analyze the data collected with pre-defined and custom sets using the Reports option.
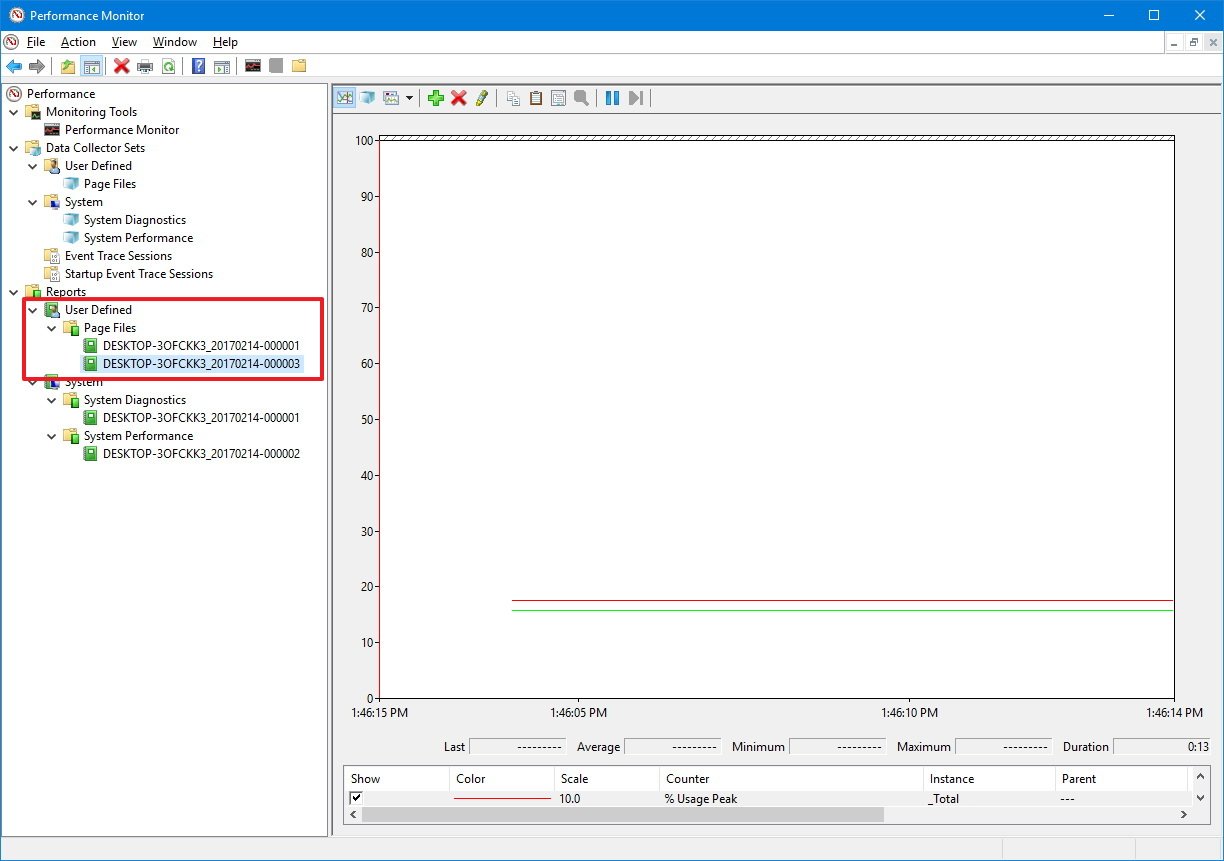
To view and analyze the data collected, simply go to Reports, and select the report you want to see.
If you're opening one of the System reports, you'll see data arrange in a more meaningful way allowing you to quickly identify any issues on your computer.
On the other hand, when you open a custom report, you'll only be able to see a recording of the data collected, which still useful to help analyze your custom set.
Wrapping things up
Although you can use other tools, such as Task Manager to monitor your system's performance, the Performance Monitor is a more advanced tool that allows you to monitor virtually anything on your computer. And once you understand it, Performance Monitor can be a valuable tool to analyze and fix any performance problems on Windows 10.
More Windows 10 resources
For more help articles, coverage, and answers on Windows 10, you can visit the following resources:
- Windows 10 on Windows Central – All you need to know
- Windows 10 help, tips, and tricks
- Windows 10 forums on Windows Central

Mauro Huculak has been a Windows How-To Expert contributor for WindowsCentral.com for nearly a decade and has over 22 years of combined experience in IT and technical writing. He holds various professional certifications from Microsoft, Cisco, VMware, and CompTIA and has been recognized as a Microsoft MVP for many years.
 Windows Central Insider


